Fig. 1
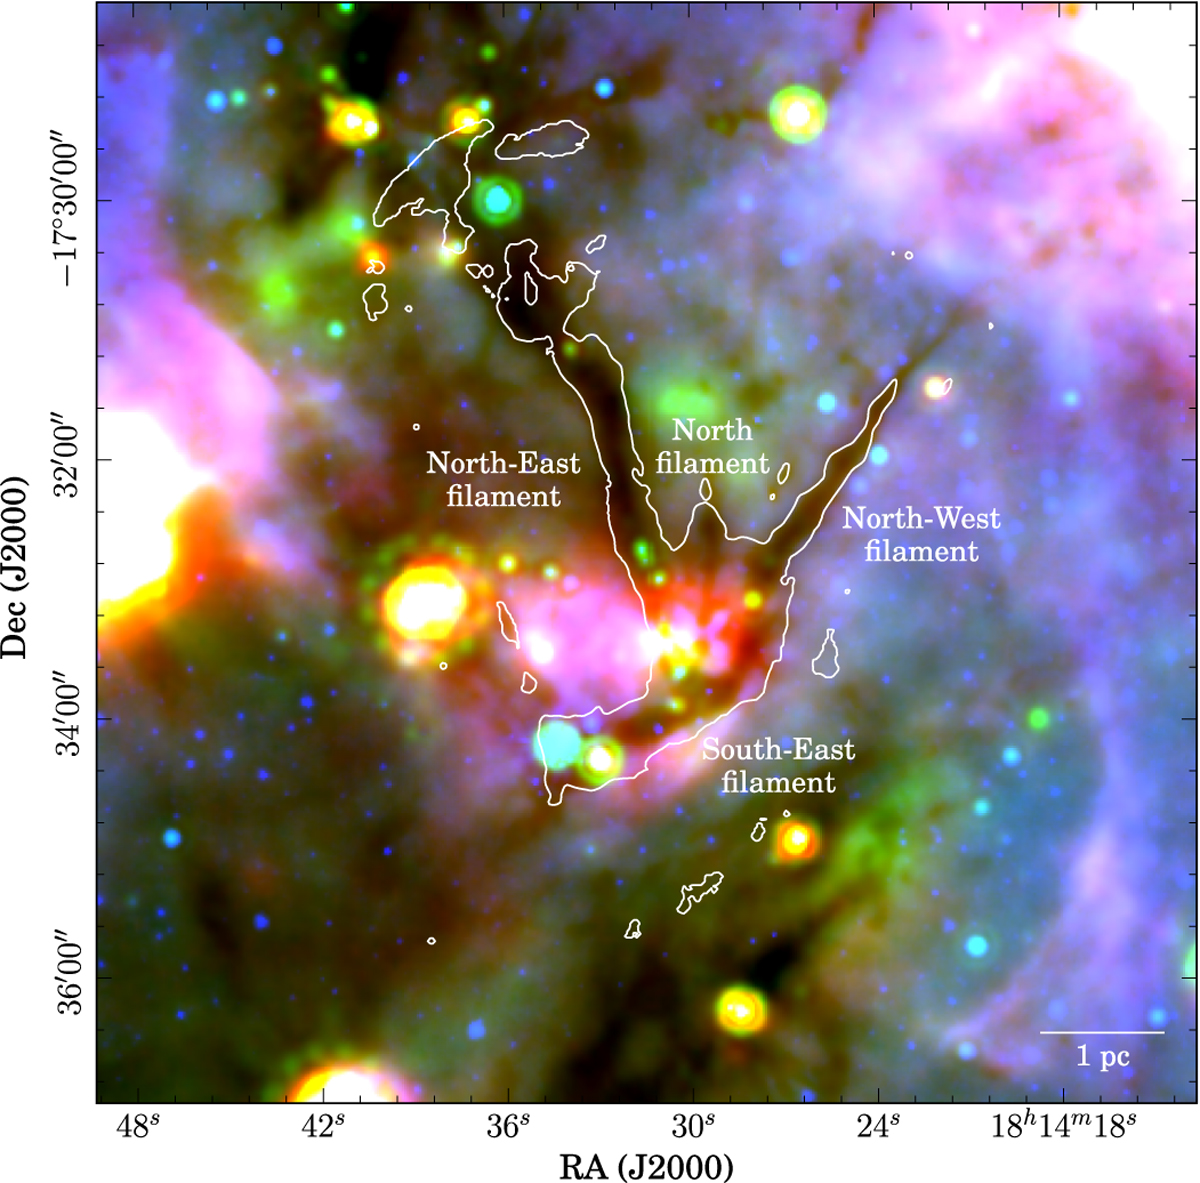
Three colour image of SDC13. R, G and B bands correspond to 70 μm HIGAL (Molinari et al. 2010), 24 μm Spitzer MIPSGAL (Carey et al. 2009) and 8 μm Spitzer GLIMPSE (Churchwell et al. 2009) maps, respectively. The overplotted contour is from the H2 column density map at 2 × 1022 cm−2 (see Sect. 3.2 and the middle panel of Fig. 5). A 1 pc scale bar is plotted in the bottom right corner. The filament names are labelled following those used by Peretto et al. (2014).
Current usage metrics show cumulative count of Article Views (full-text article views including HTML views, PDF and ePub downloads, according to the available data) and Abstracts Views on Vision4Press platform.
Data correspond to usage on the plateform after 2015. The current usage metrics is available 48-96 hours after online publication and is updated daily on week days.
Initial download of the metrics may take a while.