Fig. 5
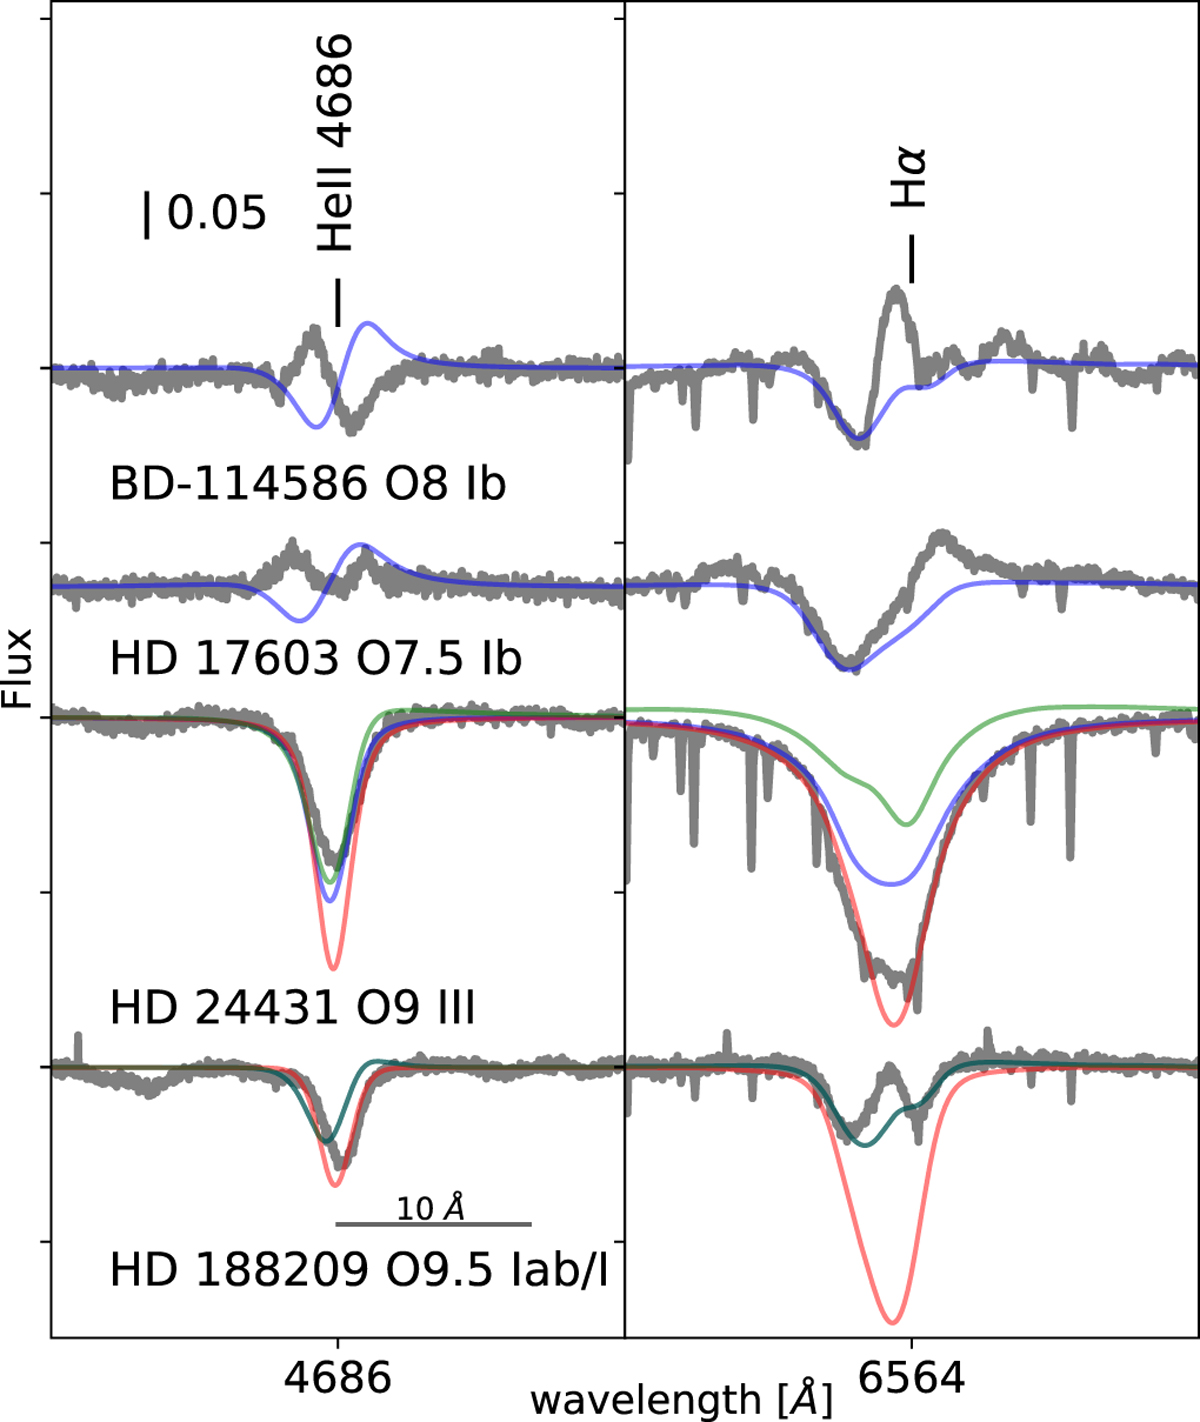
Four illustrative examples of stars in which a good fit could not be achieved. Solid blue lines correspond to the synthetic spectra of the best fitting FASTWIND model resulting from the IACOB-GBAT analysis. For HD 24431 and HD 188209 (stars labeled with the Q3 quality flag) we also include the synthetic spectra of two models with different values of the Q parameter (see text for details) where green (red) corresponds to higher (lower) Q, respectively. For HD 188209 green and blue lines are overlapped.
Current usage metrics show cumulative count of Article Views (full-text article views including HTML views, PDF and ePub downloads, according to the available data) and Abstracts Views on Vision4Press platform.
Data correspond to usage on the plateform after 2015. The current usage metrics is available 48-96 hours after online publication and is updated daily on week days.
Initial download of the metrics may take a while.