Fig. D.7
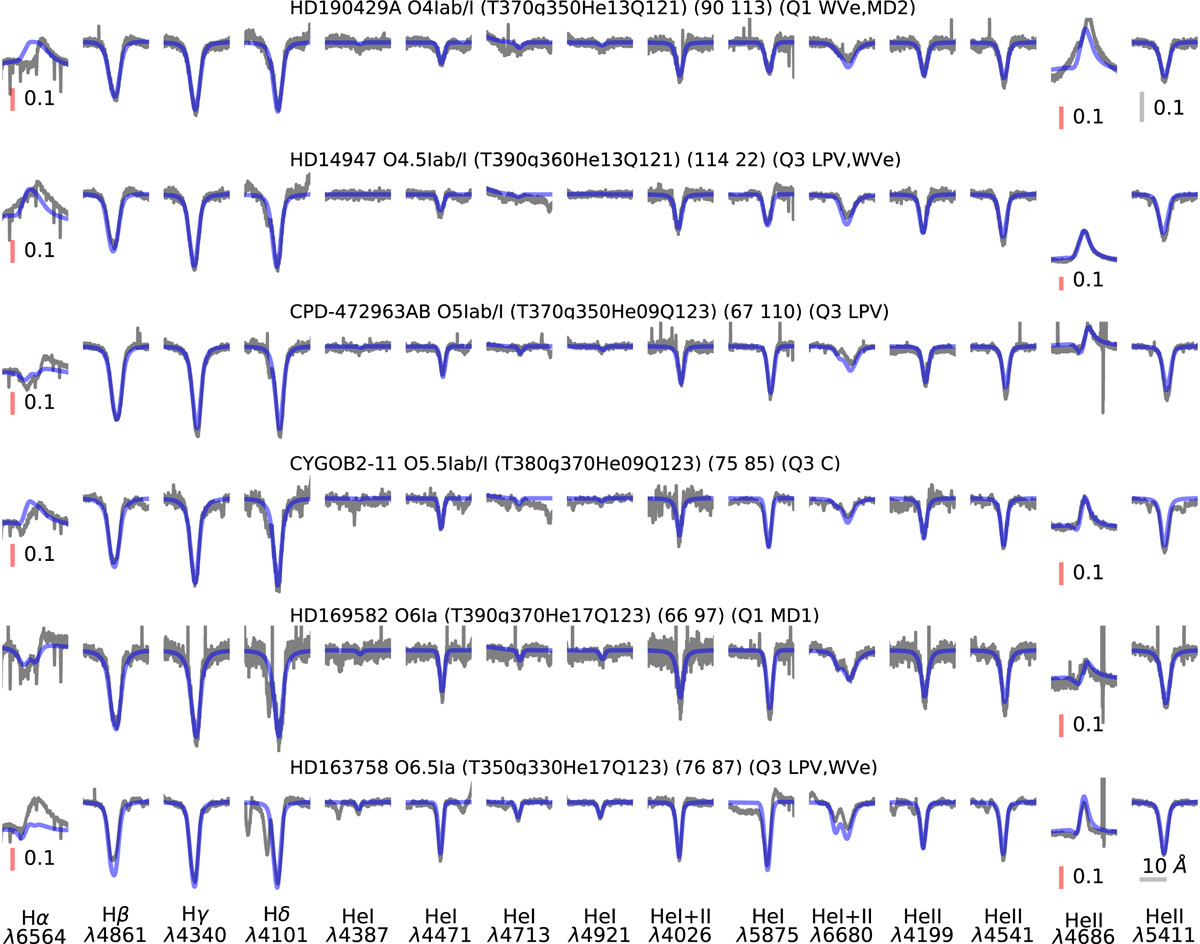
Observed spectra (gray) and best fitting model (blue) comparison for the main diagnostic lines. The sample is sorted following Table D.2. Each star is labeled with its name and spectral class, the model used for comparison (properly convolved with resolution and vrad), v sin i and vmac values, the quality flag and notes on binarity. The scale is the same for all lines except those marked with a red scale.
Current usage metrics show cumulative count of Article Views (full-text article views including HTML views, PDF and ePub downloads, according to the available data) and Abstracts Views on Vision4Press platform.
Data correspond to usage on the plateform after 2015. The current usage metrics is available 48-96 hours after online publication and is updated daily on week days.
Initial download of the metrics may take a while.