Fig. 15
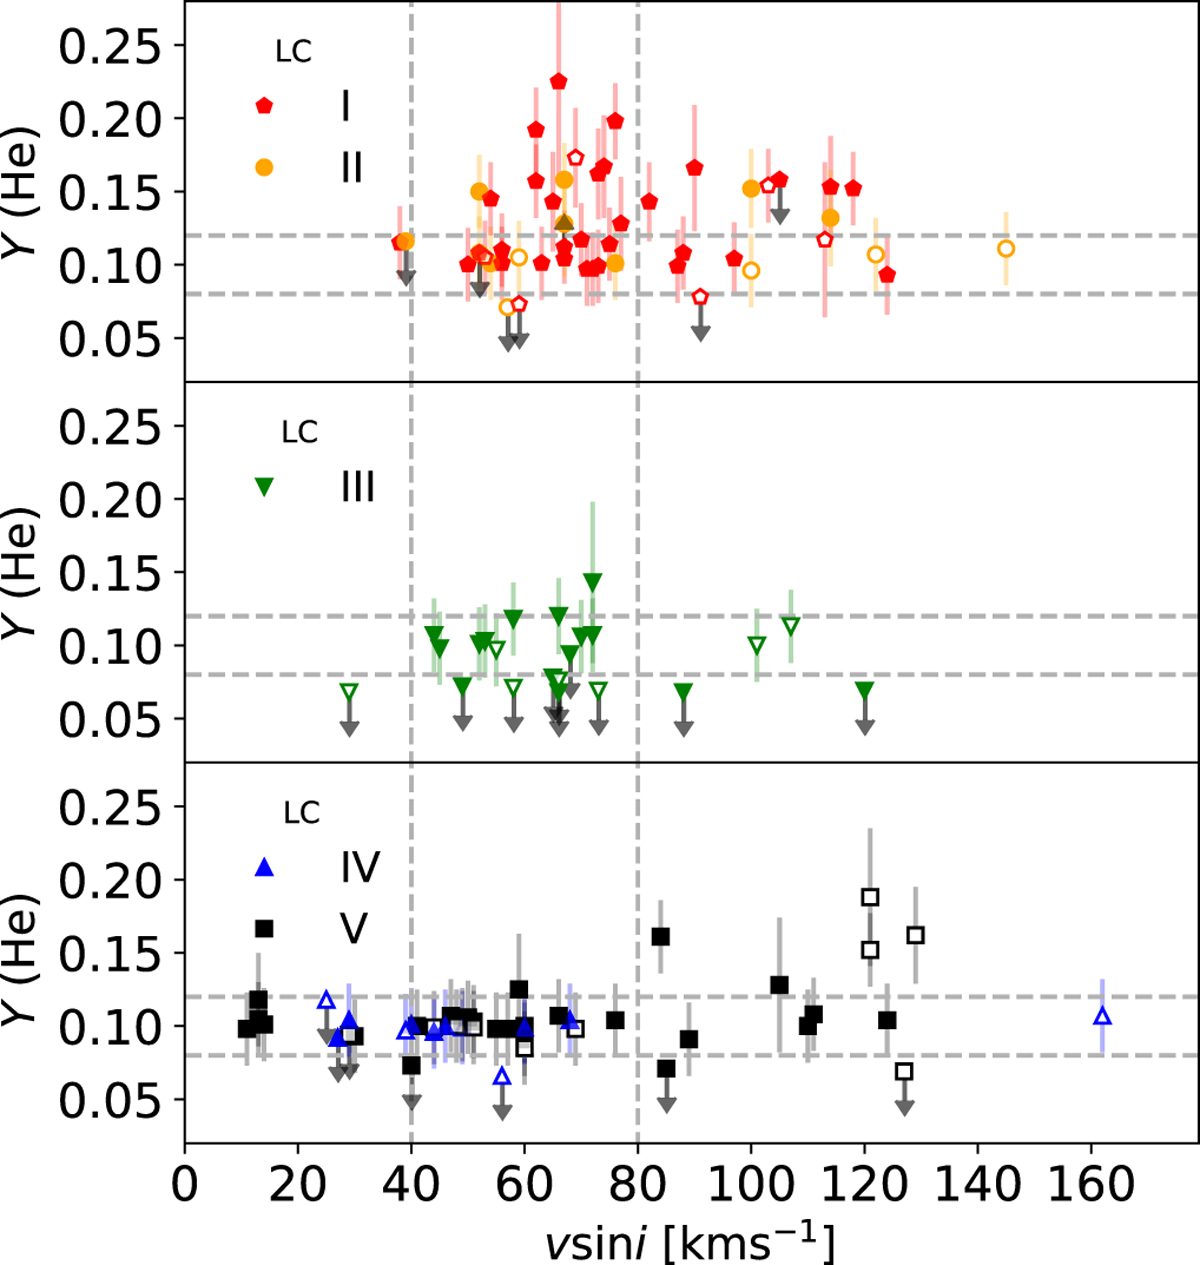
Helium abundance as a function of projected rotational velocity for the O Standard stars sample. Upper and lower limits are represented by arrows. Different colors and shapes represent luminosity classes. Open symbols indicate stars for which we have detected clear or likely signatures of spectroscopic binarity. Dashed gray lines delimit the range of values in v sin i and Y He in which most of the stars are concentrated: 50–100 km s−1 and 0.08–0.12, respectively.
Current usage metrics show cumulative count of Article Views (full-text article views including HTML views, PDF and ePub downloads, according to the available data) and Abstracts Views on Vision4Press platform.
Data correspond to usage on the plateform after 2015. The current usage metrics is available 48-96 hours after online publication and is updated daily on week days.
Initial download of the metrics may take a while.