Fig. 12
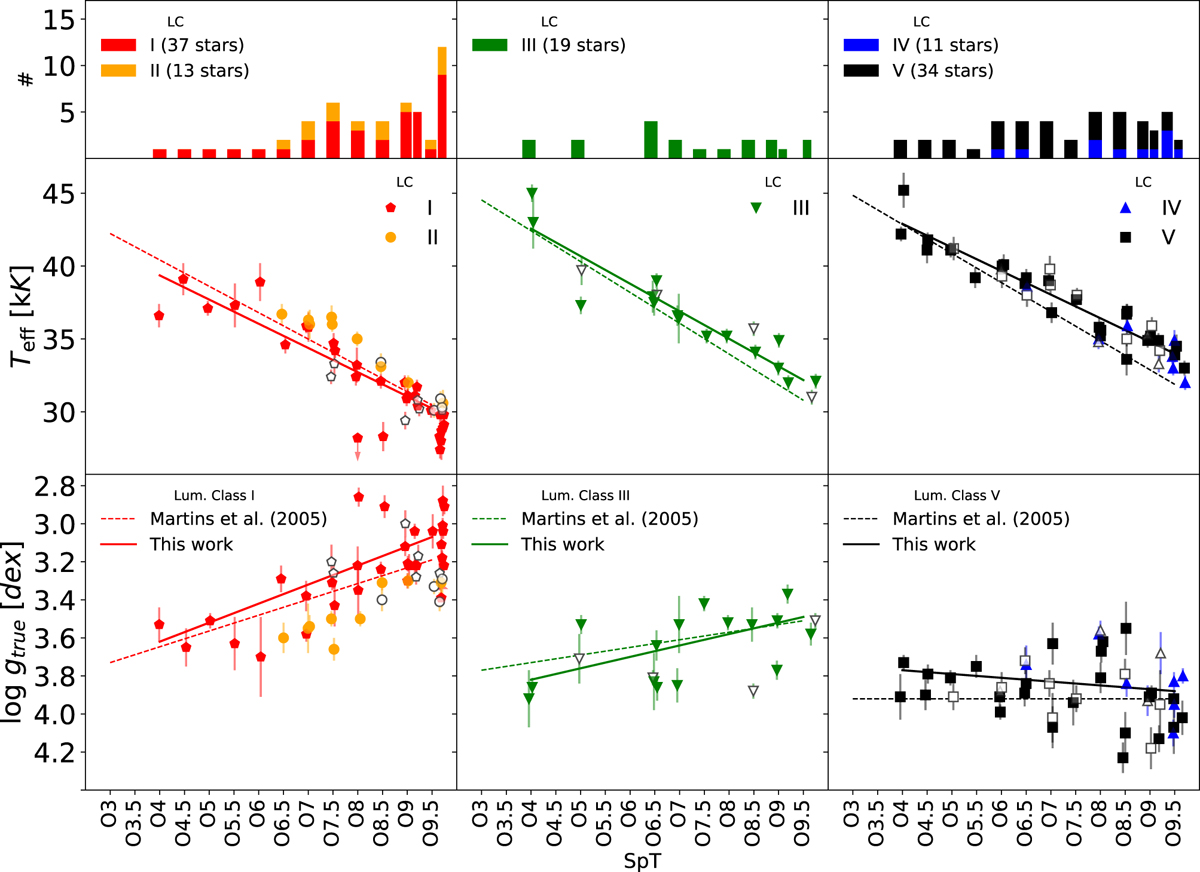
SpT–Teff (middle panels) and SpT–log g (bottom panels) calibrations. The global sample is divided by luminosity class groups in columns. Top panels: the number of stars per spectral type bin. The “observational scales” proposed by MSH05 are indicated by dashed lines. Calibrations obtained in this work are solid lines. As in previous figures, open symbols indicate stars for which we have detected clear or likely signatures of spectroscopic binarity. Stars with luminosity class Ia are not considered for the calibrations presented inTable 5, and as solid lines in these figures.
Current usage metrics show cumulative count of Article Views (full-text article views including HTML views, PDF and ePub downloads, according to the available data) and Abstracts Views on Vision4Press platform.
Data correspond to usage on the plateform after 2015. The current usage metrics is available 48-96 hours after online publication and is updated daily on week days.
Initial download of the metrics may take a while.