Fig. 6
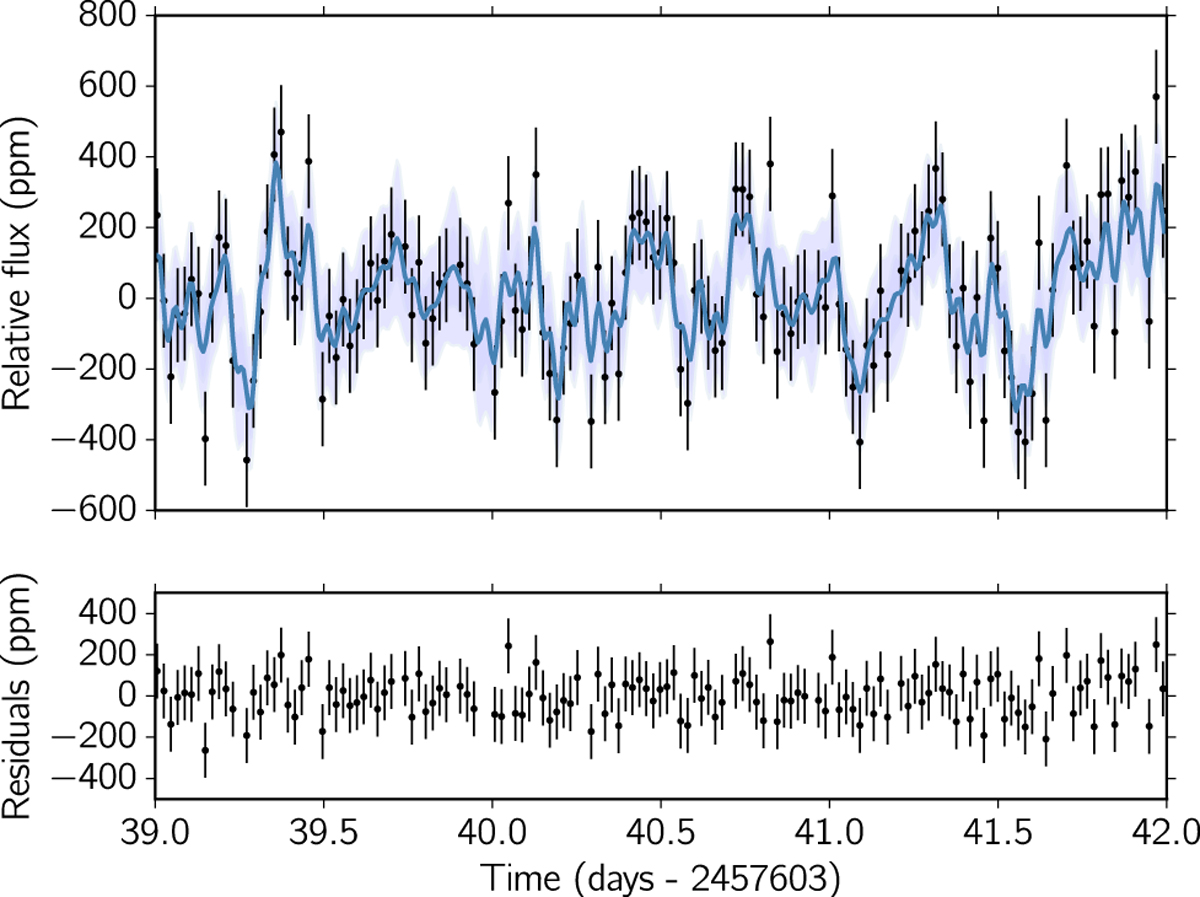
Top panel: portion of the K2 photometry of the target star. The error bars correspond to the fitted value of σw using our noise model. The blue line with bands shows the posterior prediction of our GP modeling at the given times and the 2-σ credibility interval, respectively. Bottom panel: Residuals between the fitted GP and the K2 photometry. No obvious structure is observed in the residuals.
Current usage metrics show cumulative count of Article Views (full-text article views including HTML views, PDF and ePub downloads, according to the available data) and Abstracts Views on Vision4Press platform.
Data correspond to usage on the plateform after 2015. The current usage metrics is available 48-96 hours after online publication and is updated daily on week days.
Initial download of the metrics may take a while.