Free Access
Fig. 7
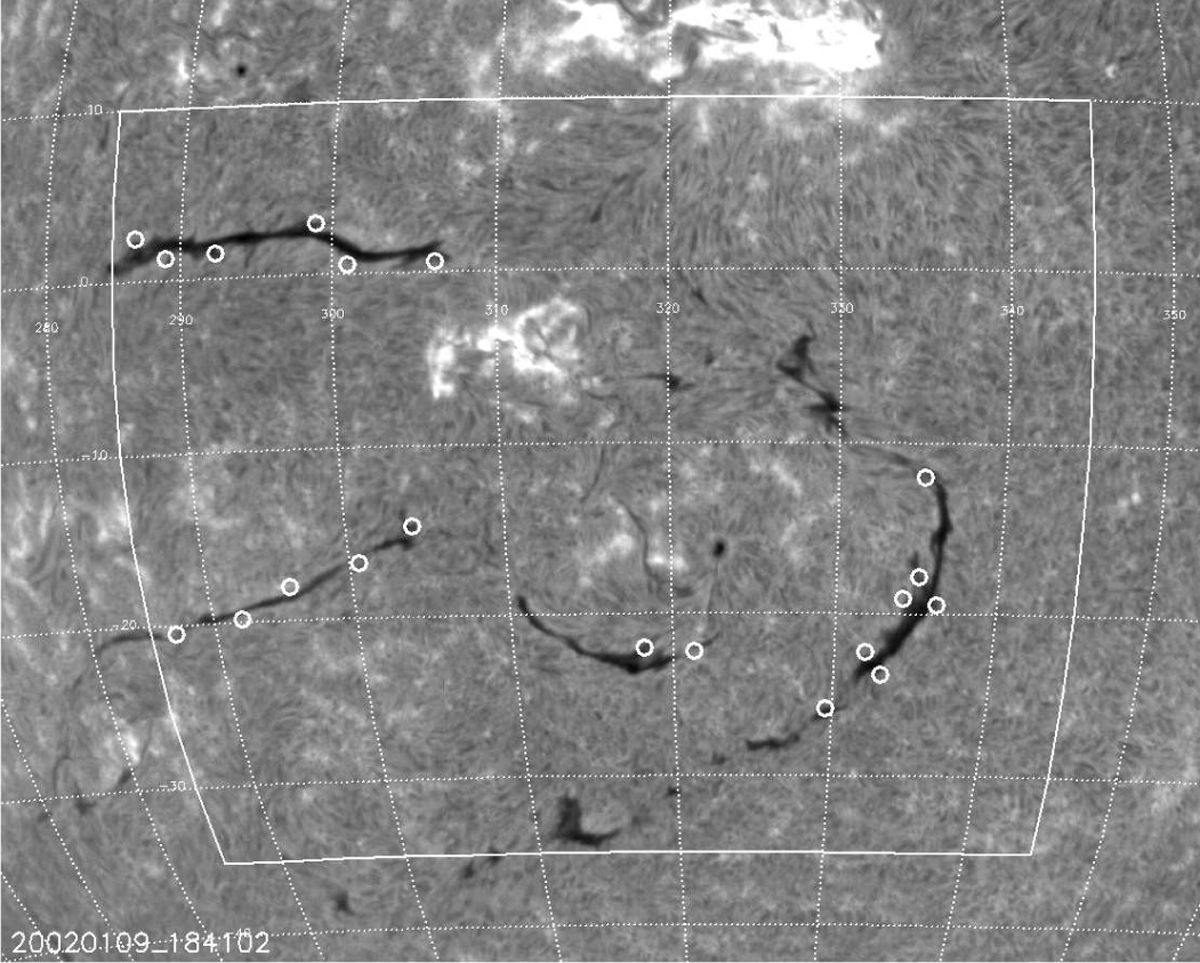
The Hα image from BBSO of region No. 13 (Table 1) from January 9, 2002, taken at 18:41 UT. Small white circles indicate the end points of the barbs of the filaments. White lines are borders of the region, where the horizontal velocity field was calculated.
Current usage metrics show cumulative count of Article Views (full-text article views including HTML views, PDF and ePub downloads, according to the available data) and Abstracts Views on Vision4Press platform.
Data correspond to usage on the plateform after 2015. The current usage metrics is available 48-96 hours after online publication and is updated daily on week days.
Initial download of the metrics may take a while.