Fig. 6
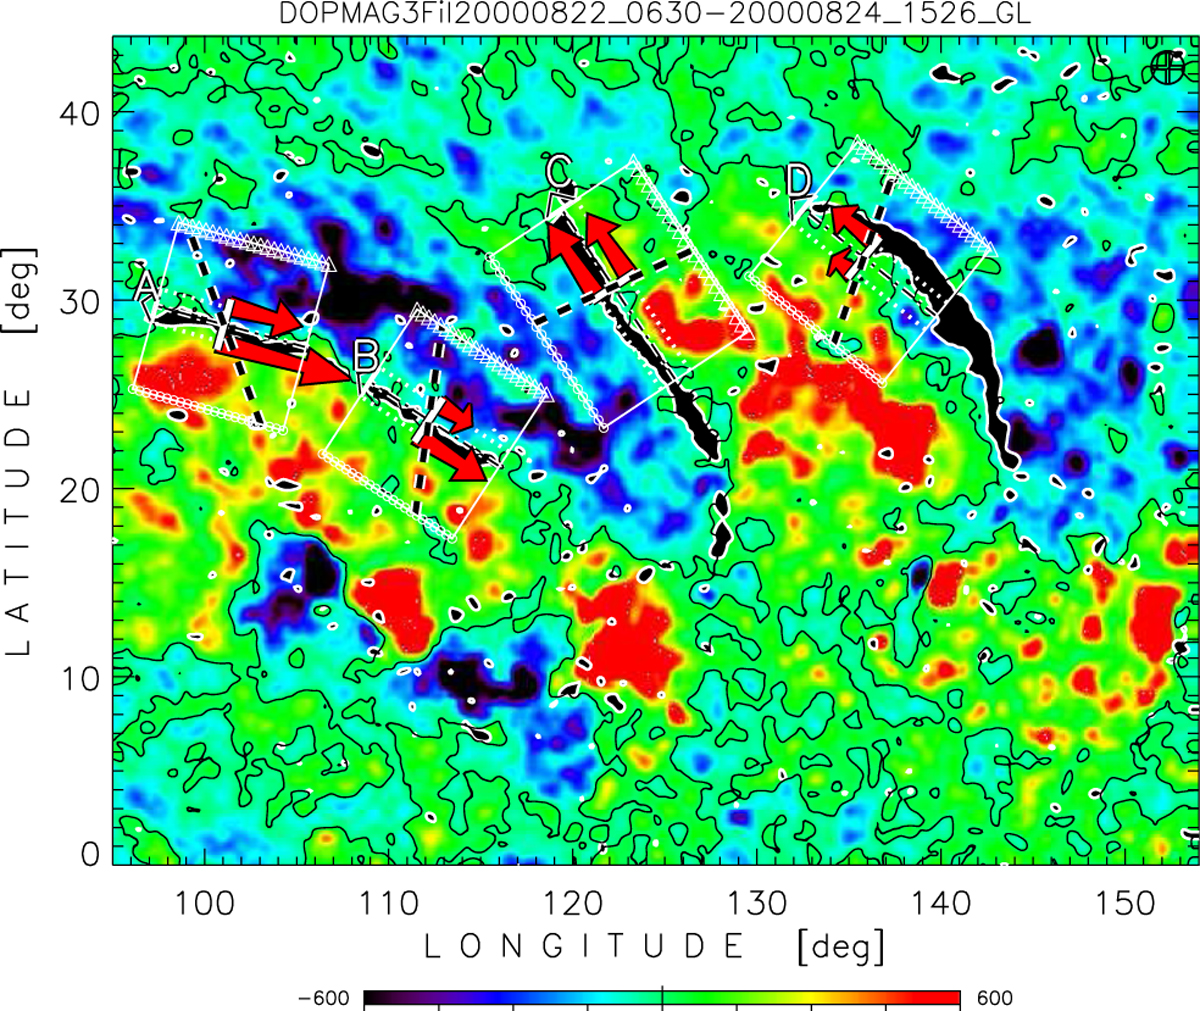
Measurements of the average axial velocities near four filaments on August 22–24, 2000. Filaments are shown as black profiles with white borders. The white test boxes are oriented along the projected line of anchoring feet of the filaments. On both sides of the axis are white dotted lines along which the average values of the axial velocities were calculated. The velocity ratio is shown by two thick red arrows, whose lengths are proportional to the velocity difference, which is also shown as an inclined black dashed line.
Current usage metrics show cumulative count of Article Views (full-text article views including HTML views, PDF and ePub downloads, according to the available data) and Abstracts Views on Vision4Press platform.
Data correspond to usage on the plateform after 2015. The current usage metrics is available 48-96 hours after online publication and is updated daily on week days.
Initial download of the metrics may take a while.