Fig. 3
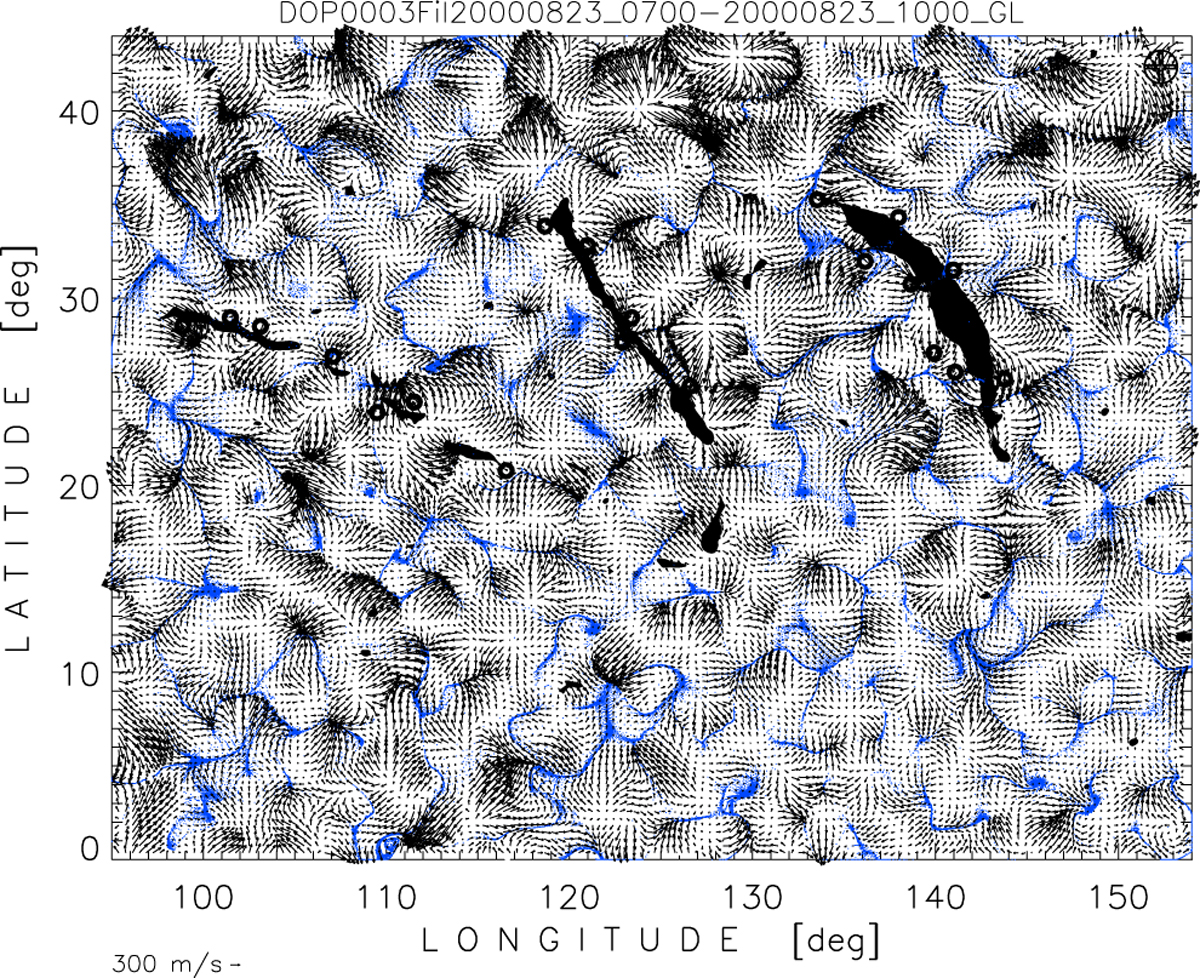
Area No. 1 from Table 1 as velocity field overlaid with corks (blue), both from LCT methods applied on Dopplergrams in the interval from 7 UT to 10 UT on August 23, 2000, and filaments from KSO Hα observed at 8:23 UT. The blue corks gather at areas with high convergence of the velocity field. The scaling vector of the velocity field is shown in the lower-left corner. In the upper-right corner a circle with a cross shows the size of the convolution window for the LCT method (i.e., the LCT resolution). The small rings near the filaments indicate the locations of the barbs.
Current usage metrics show cumulative count of Article Views (full-text article views including HTML views, PDF and ePub downloads, according to the available data) and Abstracts Views on Vision4Press platform.
Data correspond to usage on the plateform after 2015. The current usage metrics is available 48-96 hours after online publication and is updated daily on week days.
Initial download of the metrics may take a while.