Free Access
Fig. 15
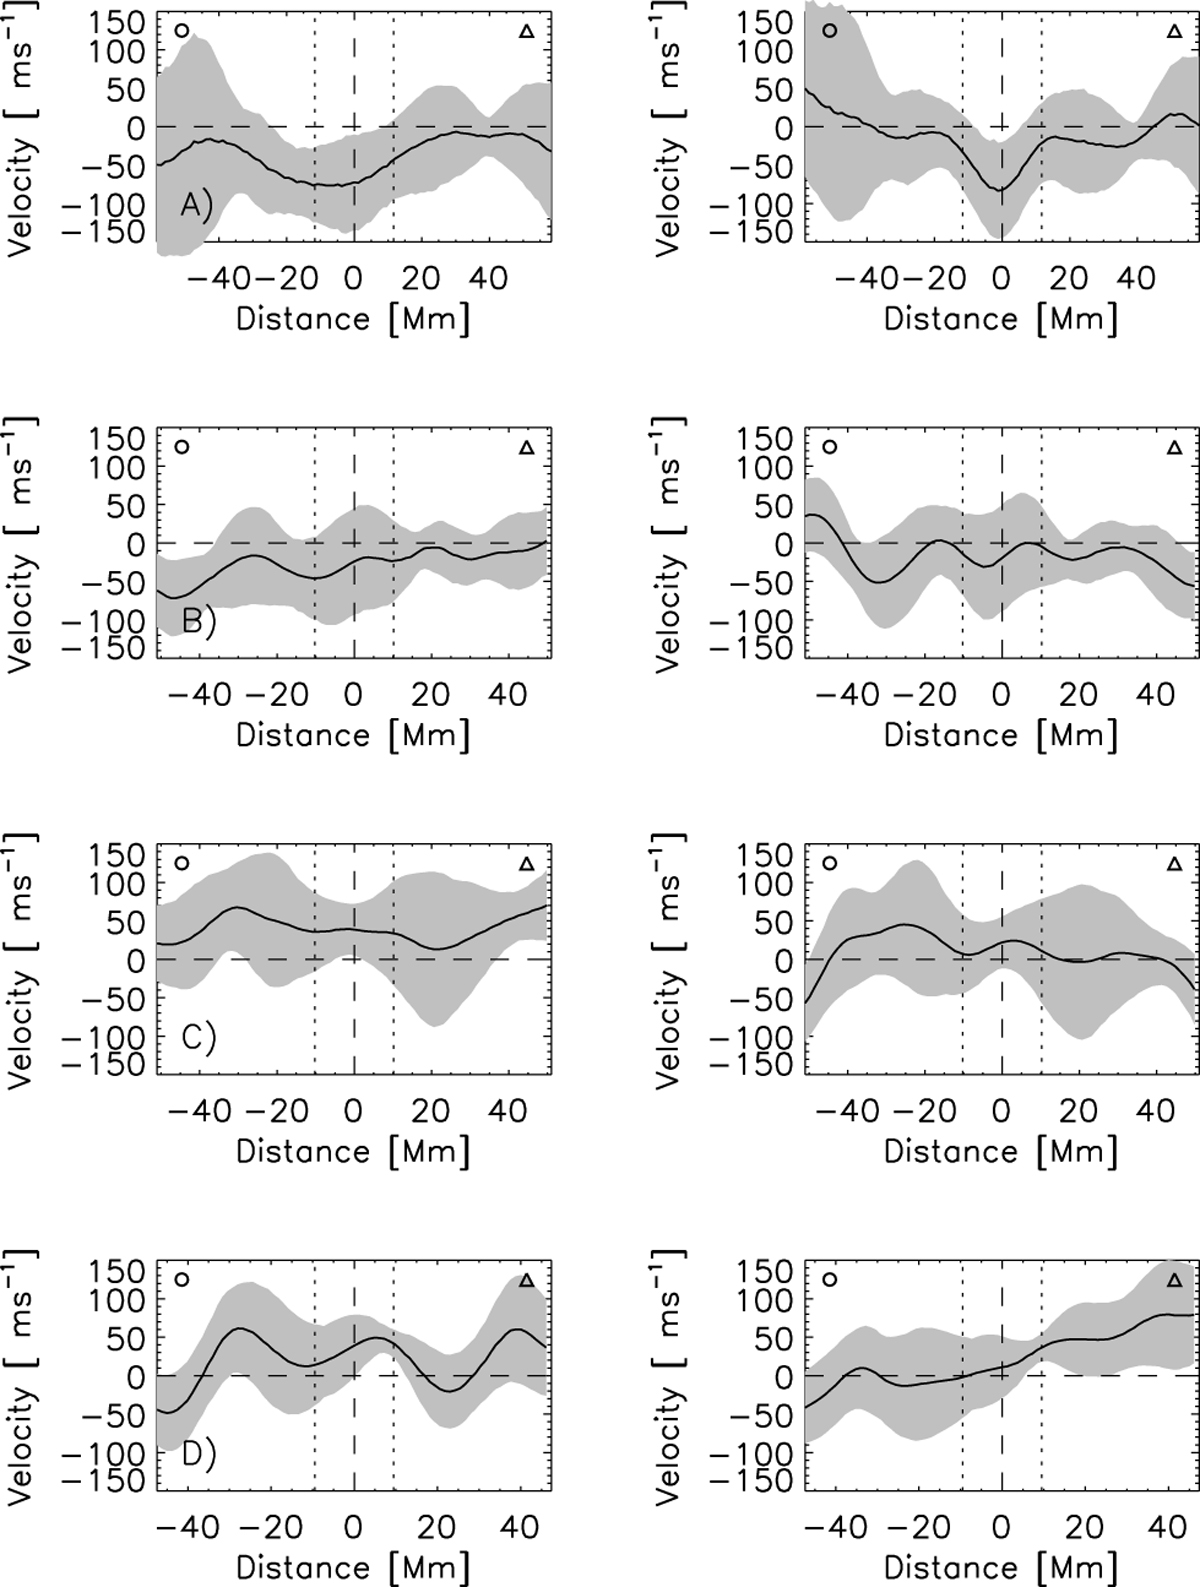
Graphical representation of mean axial ![]() (left col.) and transverse
(left col.) and transverse ![]() (right col.) velocities depending on the distances from the axis for each test box in Fig. 6 (August 22–24, 2000). The gray areas represent the standard deviations of the average values.
(right col.) velocities depending on the distances from the axis for each test box in Fig. 6 (August 22–24, 2000). The gray areas represent the standard deviations of the average values.
Current usage metrics show cumulative count of Article Views (full-text article views including HTML views, PDF and ePub downloads, according to the available data) and Abstracts Views on Vision4Press platform.
Data correspond to usage on the plateform after 2015. The current usage metrics is available 48-96 hours after online publication and is updated daily on week days.
Initial download of the metrics may take a while.