Free Access
Fig. 11
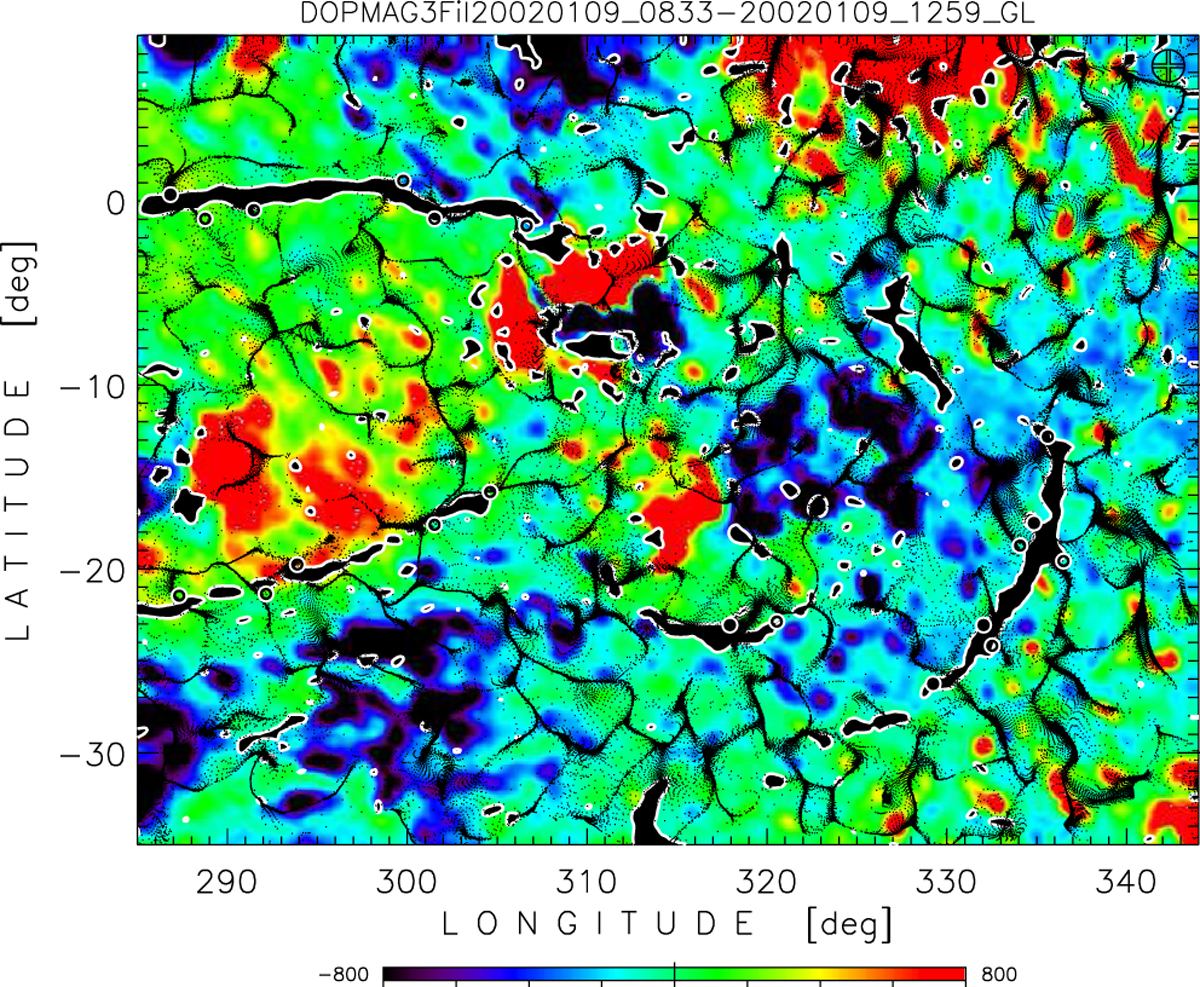
AreaNo. 13 from Table 1 on the southern hemisphere as an overlay of corks on the magnetic field (in color) on January 9, 2000, from 8:303 UT to 12:59 UT. The small circles near the black filament’s profile indicate the endpoints of the barbs. The magnetic field scale is in Gauss.
Current usage metrics show cumulative count of Article Views (full-text article views including HTML views, PDF and ePub downloads, according to the available data) and Abstracts Views on Vision4Press platform.
Data correspond to usage on the plateform after 2015. The current usage metrics is available 48-96 hours after online publication and is updated daily on week days.
Initial download of the metrics may take a while.