Free Access
Fig. 17
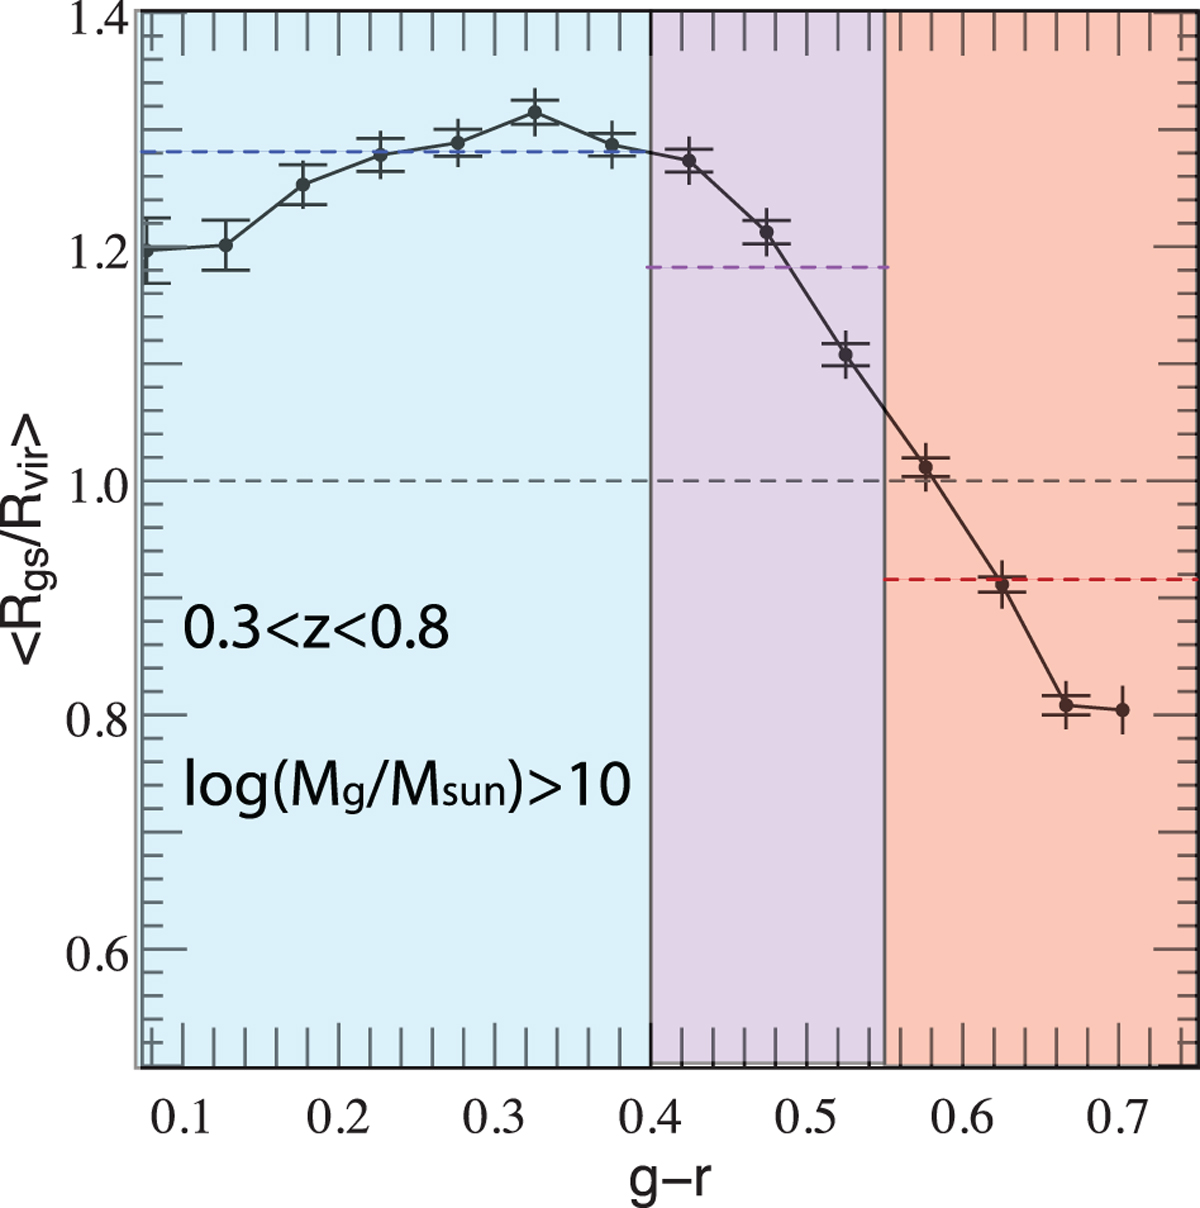
Evolution of the mean (rescaled) central-satellite separation as a function of the satellite g − r colour (for all satellites within Rgs < 5 Rvir). Our colour bins are overplotted as coloured areas and the average separation in each bin is indicated by a dashed line.
Current usage metrics show cumulative count of Article Views (full-text article views including HTML views, PDF and ePub downloads, according to the available data) and Abstracts Views on Vision4Press platform.
Data correspond to usage on the plateform after 2015. The current usage metrics is available 48-96 hours after online publication and is updated daily on week days.
Initial download of the metrics may take a while.