Fig. 13
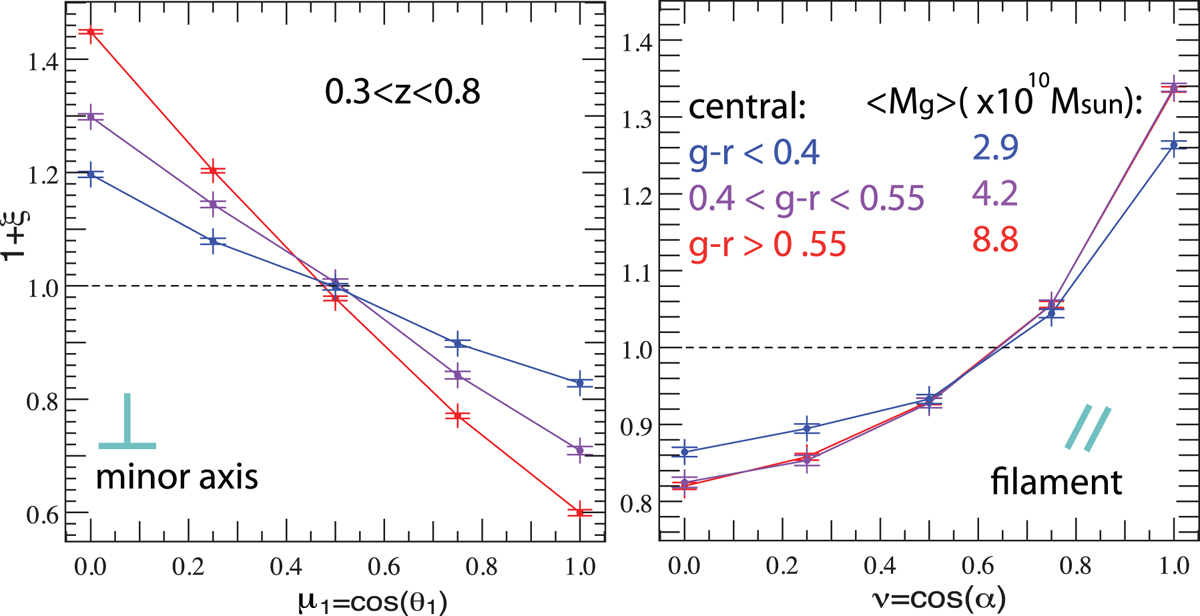
Left panel: PDF of μ1 = cos θ1, the angle between the minor axis of the central galaxy and the vector separating it from its satellites, at 0.3 < z < 0.8 and for different colour bins. Right panel: PDF of ν = cos α, the angle between the satellite separation vector and the direction of the nearest filament. The average central galaxy mass in each colour bin is also indicated. For massive red central galaxies, the satellites tend to be distributed on the galactic plane. The filamentary trend is also recovered although degraded by projection for the bluest central colour range.
Current usage metrics show cumulative count of Article Views (full-text article views including HTML views, PDF and ePub downloads, according to the available data) and Abstracts Views on Vision4Press platform.
Data correspond to usage on the plateform after 2015. The current usage metrics is available 48-96 hours after online publication and is updated daily on week days.
Initial download of the metrics may take a while.