Fig. 3
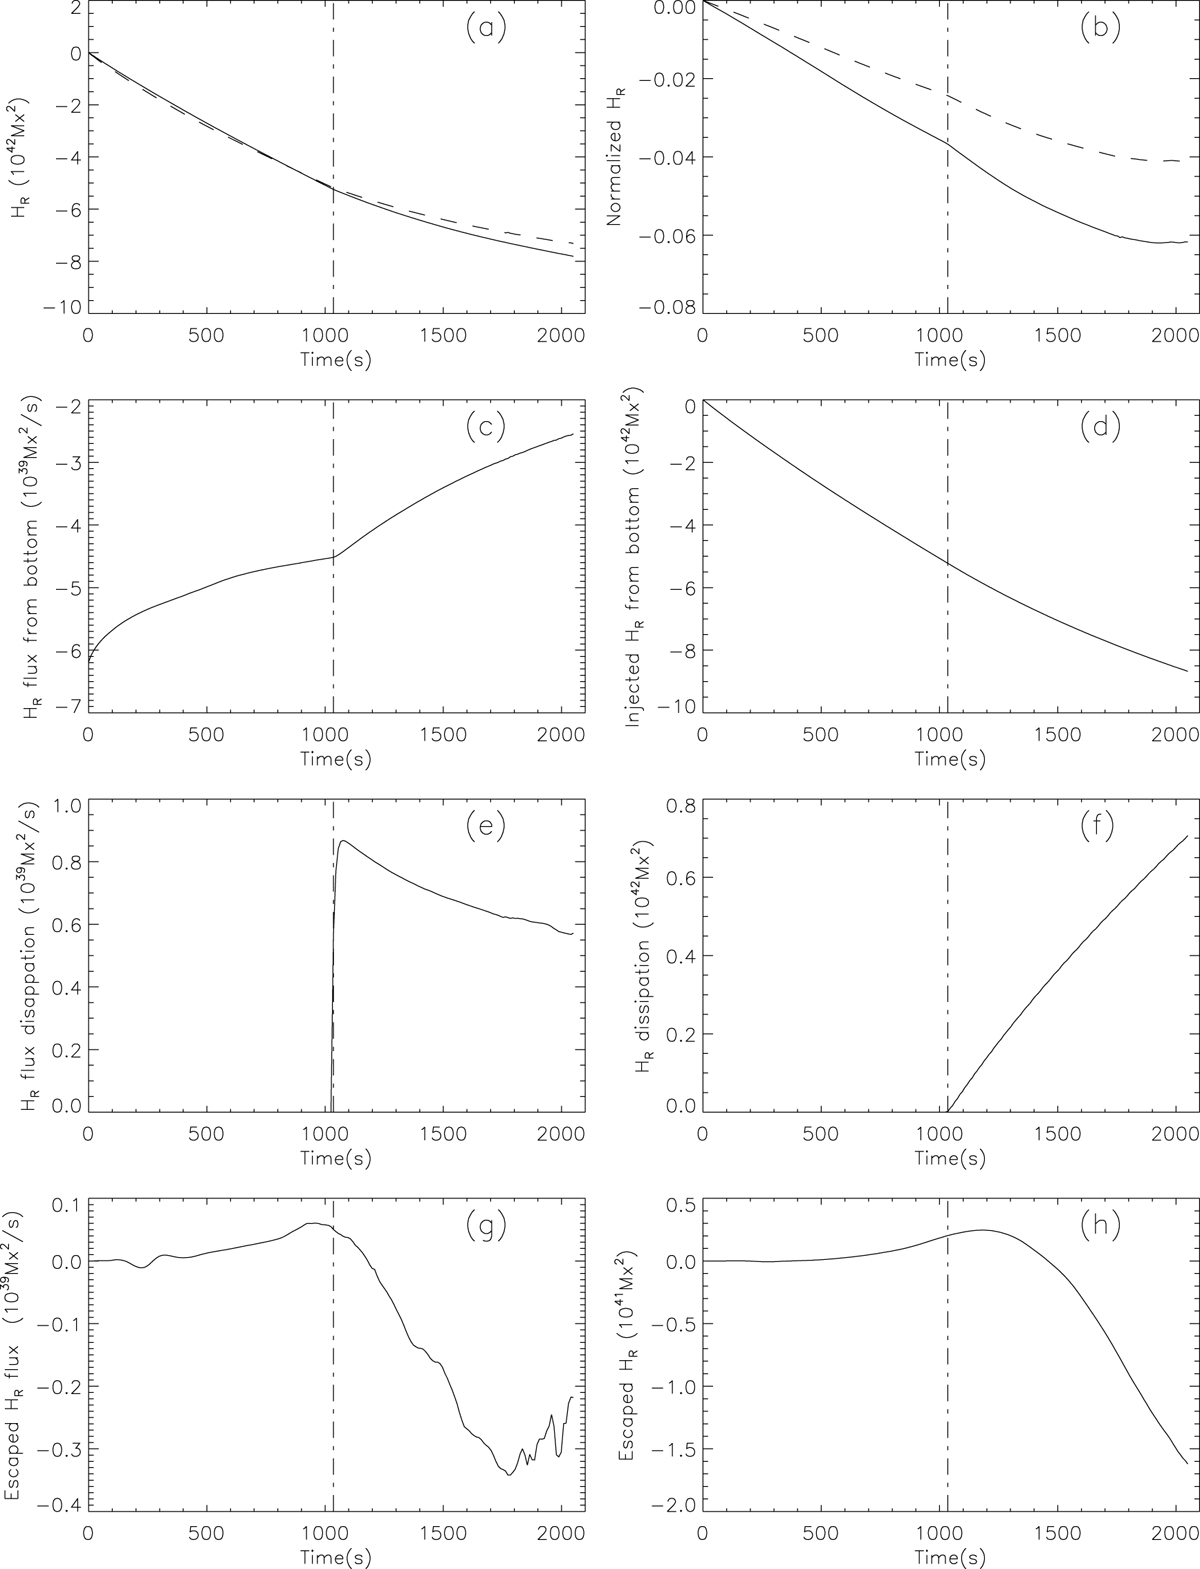
Relative magnetic helicity evolution calculation using the result of the GOEMHD3 simulation. The dash-dotted line represents the time when the fast reconnection started (t = 1035s). (a) Relative magnetic helicity in the simulation box (dashedline) and the accumulated relative helicity (solid line) sum of the helicity injection through the boundary and the dissipated in the volume helicity according to Eq. (6) in Yang et al. (2013). (b) Evolution of the normalized relative helicity, where the magnetic helicity is normalized by unsigned flux at the bottom boundary (solid line) and the six side boundaries (dashed line). (c) Injected magnetic helicity flux through the bottom boundary. (d) Injected magnetic helicity from the bottom boundary. (e) Magnetic helicity dissipation rate in the simulation box. (f) Magnetic helicity dissipation in the simulation box. (g) Magnetic helicity change rate escaped from the other five boundaries except the bottom boundary. (h) Magnetic helicity escaped from the upper five boundaries.
Current usage metrics show cumulative count of Article Views (full-text article views including HTML views, PDF and ePub downloads, according to the available data) and Abstracts Views on Vision4Press platform.
Data correspond to usage on the plateform after 2015. The current usage metrics is available 48-96 hours after online publication and is updated daily on week days.
Initial download of the metrics may take a while.