Fig. 3
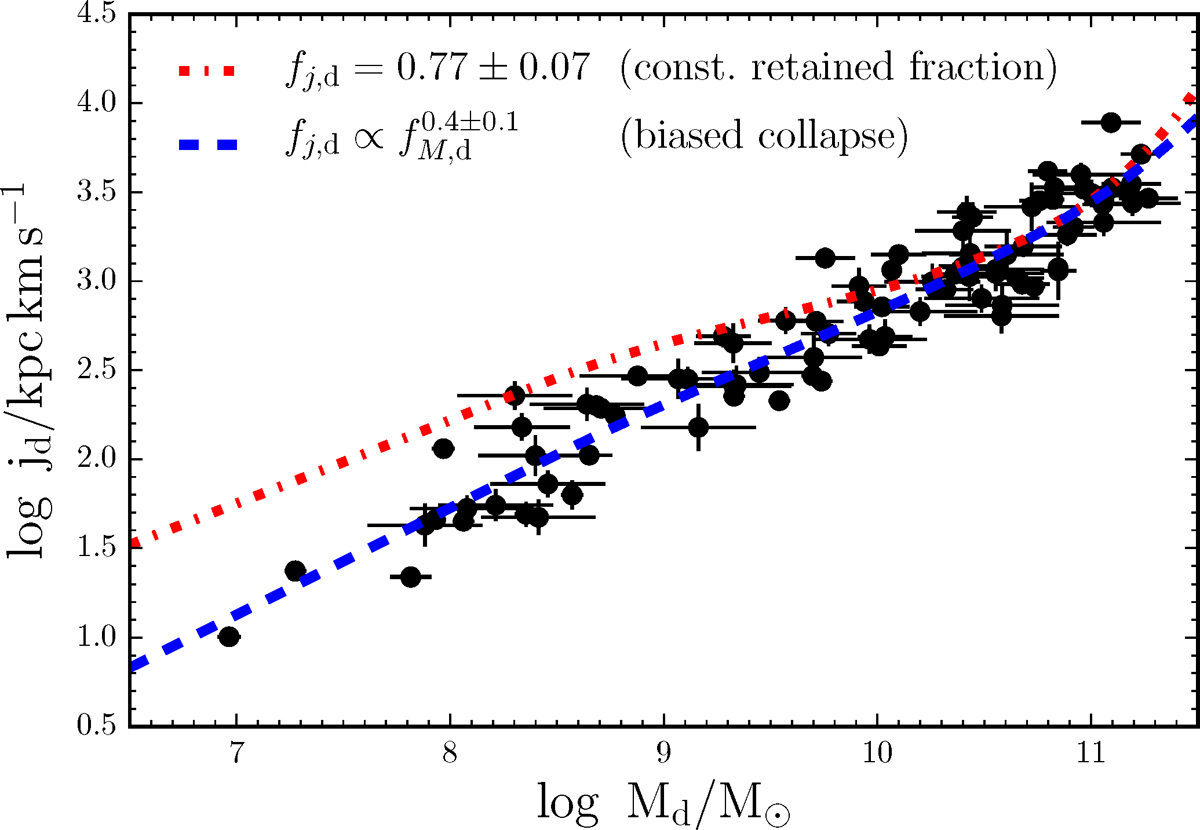
Predicted distribution in the jd−Md plane of a model with a constant retained fraction of angular momentum fj (red dot-dashed line) and for a biased collapse model (blue dashed line) compared to the data as in Fig. 2. To compute the two models we have used the stellar-to-halo mass relation from Rodríguez-Puebla et al. (2015).
Current usage metrics show cumulative count of Article Views (full-text article views including HTML views, PDF and ePub downloads, according to the available data) and Abstracts Views on Vision4Press platform.
Data correspond to usage on the plateform after 2015. The current usage metrics is available 48-96 hours after online publication and is updated daily on week days.
Initial download of the metrics may take a while.