Fig. 2
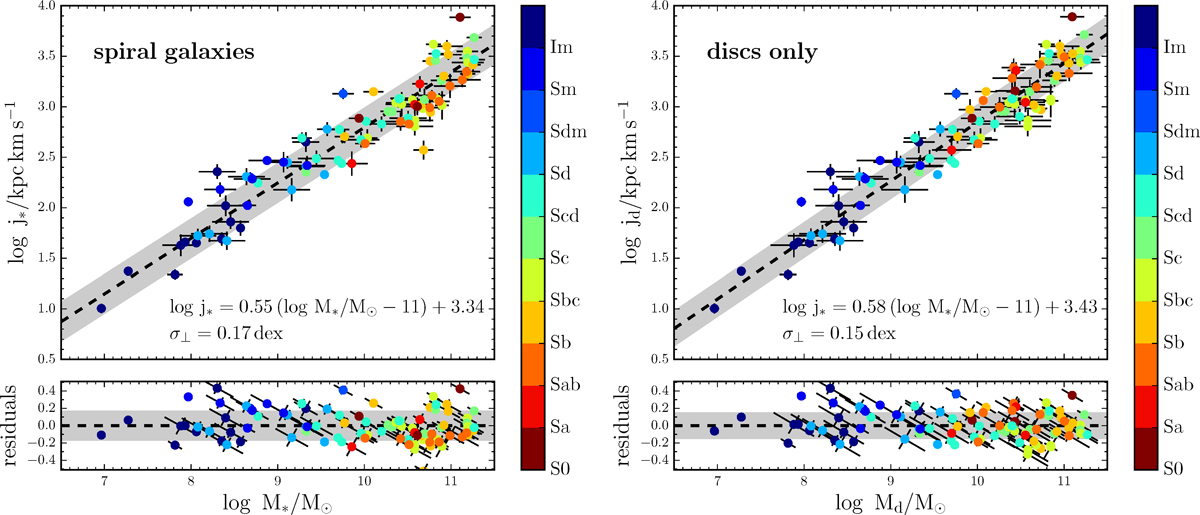
Left panel: specific stellar angular momentum-stellar mass relation (Fall relation) for a sample of 92 nearby disc galaxy. Each galaxy is represented by a circle coloured by Hubble type. The black dashed line is the best-fitting linear model and the grey band is the 1σ orthogonal intrinsic scatter. Bottom panel: orthogonal residuals around the linear model. Right panel: as in the left panel, but for the discs only (i.e. after removing the contribution from the bulges).
Current usage metrics show cumulative count of Article Views (full-text article views including HTML views, PDF and ePub downloads, according to the available data) and Abstracts Views on Vision4Press platform.
Data correspond to usage on the plateform after 2015. The current usage metrics is available 48-96 hours after online publication and is updated daily on week days.
Initial download of the metrics may take a while.