| Issue |
A&A
Volume 612, April 2018
|
|
|---|---|---|
| Article Number | L8 | |
| Number of page(s) | 4 | |
| Section | Letters to the Editor | |
| DOI | https://doi.org/10.1051/0004-6361/201832880 | |
| Published online | 07 May 2018 | |
Letter to the Editor
Disk stars in the Milky Way detected beyond 25 kpc from its center
1
Instituto de Astrofísica de Canarias,
38205
La Laguna,
Tenerife, Spain
2
Departamento de Astrofísica, Universidad de La Laguna,
38206
La Laguna,
Tenerife, Spain
3
Key Laboratory of Optical Astronomy, National Astronomical Observatories, Chinese Academy of Sciences,
Beijing
100012, PR China
4
University of Chinese Academy of Sciences,
Beijing
100012, PR China
Received:
22
February
2018
Accepted:
5
April
2018
Abstract
Context. The maximum size of the Galactic stellar disk is not yet known. Some studies have suggested an abrupt drop-off of the stellar density of the disk at Galactocentric distances R ≳ 15 kpc, which means that in practice no disk stars or only very few of them should be found beyond this limit. However, stars in the Milky Way plane are detected at larger distances. In addition to the halo component, star counts have placed the end of the disk beyond 20 kpc, although this has not been spectroscopically confirmed so far. Aims. Here, we aim to spectroscopically confirm the presence of the disk stars up to much larger distances.
Methods. With data from the LAMOST and SDSS-APOGEE spectroscopic surveys, we statistically derived the maximum distance at which the metallicity distribution of stars in the Galactic plane is distinct from that of the halo populations.
Results. Our analysis reveals the presence of disk stars at R > 26 kpc (99.7% C.L.) and even at R > 31 kpc (95.4% C.L.).
Key words: Galaxy: structure – Galaxy: disk – Galaxy: abundances
© ESO 2018
1 Introduction
The disk of our Galaxy has an exponential radial profile (Vaucouleurs & Pence 1978; Bahcall & Soneira 1980), which means that the density of stars quickly decreases away from the center, although in principle a few stars should be present at very large distances from the center and some of them could be detected. With a typical scale length of 2 kpc (López-Corredoira & Molgó 2014, hereafter LM14) and a solar neighborhood surface density of visible stars (main-sequence and giants) of 27 M⊙ pc−2 (McKee et al. 2015), the surface density at a Galactocentric distance of R = 25 kpc would be ~ 5 × 10³ M⊙ kpc−2. Only 2% of the mass is due to giant stars (McKee et al. 2015), which are bright enough to be detected spectroscopically at these distances, so that the mass density associated with the giants would be ~ 100 M⊙ kpc−2, that is, only very few giant stars, but a significant number are expected to be detected.
Some authors (Freudenreich et al. 1994; Ruphy et al. 1996; Porcel et al. 1997; Sale et al. 2010; Minniti et al. 2011; Amôres et al. 2017) have argued that the density of disk stars at R > 13–16 kpc is dramatically reduced with respect to an extrapolation of the exponential disk with the scale length of the inner disk. However, it is suspected that they expected a significant drop-off of stars because the flare of the Galactic disk becomes strong at these Galactocentric distances (LM14), and the stars are therefore distributed over a much wider range of heights, which produces this apparent depletion of in-plane stars. The surface density may not fall off abruptly, but the stars would simply be redistributed at greater heights from the plane. The flare has also been confirmed kinematically with the measured thickening of the vertical velocity distribution (Wang et al. 2017).
Momany et al. (2006) and Reylé et al. (2009) investigated the outer disk, but limited to R < 20 kpc and with large uncertainties beyond 15 kpc. Carraro et al. (2010) found some young stars between 15 and 20 kpc from the Galactic center. Feast et al. (2014) speculated about the interpretation of five Cepheids in the outer disk 1–2 kpc from the plane, but their results are puzzling since the very young population (~ 100 Myr) of Cepheids typical of a spiral arm should not be as farther away from z = 0 plane. Liu et al. (2017) reported that the disk seems to extend at least up to R = 19 kpc, and that beyond this radius the disk smoothly transitions to the halo without any truncation, break, or upward bending. These are further indications that the disk may not end at least out to R = 20 kpc, but what happens beyond this distance? Can we provide proof of the existence of disk stars farther away? The purpose of this paper is precisely answering this question. Certainly, there are stars beyond R = 20 kpc, but many of them belong to the old population of the halo (Xu et al. 2017). LM14 previously showed the existence of stars out to R = 30 kpc, although only in regions far from the plane, and without a spectroscopic classification of their age or metallicity.
2 Method
Our methodin this paper is to search for a population typical of the thin disk, with a distribution of metallicities distinct from that of the halo, shifted toward higher metallicities. The halo metallicity distribution function (MDF) peaks at around [Fe/H] = −1.6 (Beers & Christlieb 2005; Allende Prieto et al. 2014), while the MDF of the disk reaches its maximum between roughly −0.7 and +0.25, depending upon the height over the midplane and the radial distance. (Hayden et al. 2015). Hence, metallicity by itself is useful to separate between halo and disk populations.
Specifically, our method consists of comparing the distribution of metallicities in two samples that satisfy i) a Galactocentric distance between R1 and R1 + ΔR, |z| < 5 kpc and ii) a Galactocentric distance between R2 and R2 + ΔR, |z| ≥ 5 kpc. The reason we chose a height of z = 5 kpc for the separation of the two subsamples is that the scale height of the thick disk is approximately 1 kpc and the flare of the outer disk can reach a thickness of several kpc for the disk (LM14). We set a fixed value of R1 and Δ R and fit the value of R2 in order to obtain the same average spherical Galactocentric distance for both distributions: ⟨r1 ⟩ ≈⟨r2⟩. This avoids the possible variation of the metallicity due to a gradient in the halo ([Fe/H] slightly depends on the spherical Galactocentric distance r; using data fom Fernández-Alvar et al. (2015, Fig. 6b), we derive a mean ![Mathematical equation: $\frac{\mathrm{d}[\mathrm{Fe}/\mathrm{H}]}{\mathrm{d}r}=-0.0121\pm 0.0013$](/articles/aa/full_html/2018/04/aa32880-18/aa32880-18-eq1.png) kpc−1). The non-sphericity of the halo is negligible at large radii (Xu et al. 2017).
kpc−1). The non-sphericity of the halo is negligible at large radii (Xu et al. 2017).
Comparing distributions of heliocentric radial velocities might be another way of distinguishing halo and disk populations, but this is not so straightforward and would need a priori kinematic models to separate the contribution of different Galactocentric velocity components. We therefore do not use it here.
3 Data
We carried out our analysis with data on K-giants from LAMOST-DR3 (Liu et al. 2017) in the optical and SDSS-APOGEE-DR14 (Majewski et al. 2017) in the near-infrared.
The LAMOST DR3 catalog contains 5 756 075 spectra, for which the LAMOST pipeline has provided the metallicity [Fe/H], and the distances were estimated from a Bayesian approach (Carlin et al. 2015) with uncertainties of about 20%. About 70 000 K-giants were selected from LAMOST DR3 according to the criterion of Liu et al. (2014).
The Apache Point Galactic Evolution Experiment (APOGEE) DR14 (Abolfathi et al. 2018) includes millions of spectra for approximately 263 000 stars. Distances for the stars have been estimated with four different methods (Schultheis et al. 2014; Santiago et al. 2016; Wang et al. 2016; Holtzman et al., in prep.) and were included in a value-added catalog released in conjunction with DR14. The agreement among the four codes is fair, typically within 20%. We have adopted for our analysis the average values of the available estimates, as well as the overall metallicity [M/H] values derived by the APOGEE ASPCAP pipeline (Garcí a Pérez et al. 2016), which for DR14 have been calibrated to match optical iron abundances ([Fe/H]) for clusters in the literature.
The spatial distribution of the stars considered here spans a range of Galactic longitudes that is accessible from observatories in the northern hemisphere, with those at larger R toward the anticenter. Although the overdensity of stars at R ≈ 20 kpc was attributed by some authors to tidal debris of a dwarf galaxy (Monoceros Ring), LM14 have shown that this hypothesis is unnecessary and that the overdensity can be explained by a flared disk. Here we follow the argument of LM14.
4 Results
The metallicity distributions for different R1 and for bothsurveys are given in Figs. 1 and 2. Possible selection effects on completeness do not affect the metallicity distribution (Nandakumar et al. 2017). A similar histogram was produced in Fig. 11 of Carlin et al. (2015) with LAMOST, but only with R < 20 kpc in the plane, whereas here we analyze the distributions beyond that limit. The metallicity of LAMOST halo stars was also analyzed (Xu et al. 2017), but without the stars in the plane with [Fe/H] > −1 that we include here. Tables 1 and 2 give the parameters of these distributions. The disk metallicity distribution peaks between − 1.0 and −0.5, whereas thehalo mean metallicity is a wider distribution with a maximum at about −1.5. The first range is expected from an extrapolation of the metallicity gradient from the inner disk, including both thin and thick disks (Besançon model simulation in López-Corredoira et al. 2007, Fig. 3).
The results are quite clear: significant differences are found for R < 24 kpc between the distributions in-plane and off-plane. The in-plane subsamples have disk and halo stars, whereas the off-plane subsample is composed of halo stars alone. No differences are found for R > 28 kpc in the plots.
The significance of the distributions was evaluated with a Kolmogorov-Smirnov (K-S) test, which is non-parametric and distribution independent. The K-S test has some limitations (Feigelson & Babu 2012), for instance, if the model that is compared with a data set was derived from the same data set, or when two distributions derived from data are not totally independent, but this is not the case here. Tables 1 and 2 give the probability assigned by this test to explain the different distributions as due to random fluctuations. Errors in [Fe/H] will decrease the K-S maximum distance Dmax between the two distributions, thus increasing the probability PK−S, so they cannot be responsible for a significant detection. When we vary R1 and Δ R (in a range between 0.2 and 15.0 kpc) as free parameters, the maximum significance expressed in the equivalent number of sigmas for a given probability (assuming a normal distribution; i.e., 1σ is PK−S = 0.317, 2σ is PK−S = 0.0455, 3σ is PK−S = 2.70 × 10⁻³, etc.) is given in Fig. 3. We can account for the effect of having a higher significance due to exploration of the values of R1 if we fit a smoothfunction to the inferred significances, as done in Fig. 3. A cubic polynomial fitting (lower order polynomials do not yield a good fit) of the significance, results in a difference with halo stars at 99.73% C.L. (3σ) at R1 = 24.4 kpc (LAMOST), R1 = 22.9 kpc (APOGEE). A 5σ detection is found at R1 = 22.5 kpc (LAMOST), R1 = 21.6 kpc (APOGEE). A tentative detection at 2 σ is for R1 = 26.3 kpc (LAMOST), R1 = 30.3 kpc (APOGEE).
Both surveys independently yield the same results. The APOGEE data show a metallicity distribution for the disk that is narrower than in the LAMOST data, possibly due to the lower errors in the distance determination. The APOGEE spectra have a higher resolution and signal-to-noise ratio than the LAMOST observations, but a smaller spectral range. The off-plane stars in APOGEE present a double peak, whereas in LAMOST it has only one peak, possibly due to some miscalculation of disk stars for a great distance. The minimum detected metallicity in LAMOST is also limited at [Fe/H] = −2.5 (Carlin et al. 2015), but this difference in the histograms is not important because very few stars have metallicities lower than this limit. The remaining features in the distributions are equivalent.
The two surveys are independent because they have only very few sources in common: of 3393 sources in the LAMOST sample with R > 16 kpc, |z| < 5 kpc, only 96 were observed by APOGEE, which is a coincidence lower than 3%. These 96 stars have similar distance estimates and metallicities, which corroborates the reliability of their determinations. In addition, the surveys operate at different wavelengths, with different instruments and analysis pipelines. Therefore, we can combine the statistics of the two surveys as if they were independent: summing quadratically the number of sigmas of both surveys. This is also shown in Fig. 3. This global analysis of the two surveys shows that the significant detection of a difference in metallicity distribution in in-plane stars with respect to pure halo stars, interpreted as the presence of disk stars added to the halo sources, is given for R > 23.2 kpc at 5σ, R > 26.0 kpc at 3σ, and R > 31.5 kpc at 2σ.
For LAMOST, stars with ⟨R⟩ = 26.0 kpc (3σ global detection) or ⟨R⟩ = 31.5 kpc (2σ global detection) have a mean heliocentric distance of 18.3 kpc and 23.9 kpc, respectively; according to the analysis of Carlin et al. (2015, Fig. 2/right), in comparison with the Besançon model, the corresponding average systematic overestimation of distance is +2.2 and +3.2 kpc, respectively.Wang et al. (2017, Appendix) claimed that the errors of the distances given by Carlin et al. (2015) are overestimated by a factor of two. Nonetheless, this excess of 1–3 kpc mainly affects stars with very low metallicity stars because the authors used isochrones with solar [α/Fe] (Carlin et al. 2015) and this should not affect the disk stars we analyzed at |z| < 5 kpc to find a distinction with halo population. The limit of the detection of disk stars should therefore not be significantly affected. For APOGEE, the distances were determined as the average of four independent methods that were compatible with each other within the errors (see Sect. 3), and the systematic error of heliocentric distances in comparison with cluster distances is underestimated by 4% (Wang et al. 2016). This is an average underestimation of −0.7 and −1.0 kpc for ⟨R⟩ = 26.0 kpc (3σ global detection) or ⟨R⟩ = 31.5 kpc, respectively, which places the stars even slightly farther away.
In orderto further determine possible systematic errors, we excluded from our sample of APOGEE the stars with ASPCAP pipeline (Garcí a Pérez et al. 2016) flags (ASPCAPFLAG), which is a warning of some possible difficulties for an analysis of the star. This reduces the sample by 16% of sources (22 in-plane stars at R > 24 kpc instead of 37 without the cut), and the radius at which there is a 3σ detection is R = 22.5 kpc (instead of R = 22.9 kpc). If we furthermore add another constraint and also remove stars with a warning flag in the parameter STARFLAG, which is related to issues with the spectrum, the number of sources is reduced by 54% with respect to the total sample (10 in-plane stars at R > 24 kpc instead of 37 without the cut), and the radius for a 3σ detection is R = 21.8 kpc (instead of R = 22.9 kpc). When this last subsample is combined with only 46% of the sources in APOGEE with LAMOST, we find the presence of disk stars distinct from the halo sources, at R > 22.8 kpc at 5σ, R > 24.7 kpc at 3σ, and R > 27.1 kpc at 2σ. This slight reduction of the maximum radius of the disk is due to the reduction of the number of sources, which makes the detection less significant at a given radius. We may then conclude that our results are not importantly affected by possible misclassified sources, which should introduce noise rather than signal.
This analysis corroborates through statistical spectroscopy the lack of a radial truncation in the stellar disk observed through the fit of star counts out to 30 kpc (LM14). An exponential distribution is also observed for the gas density of the Milky Way without any truncation up to a distance of 40 kpc from the center (Kalberla & Dedes 2008). This does not mean that radial truncations are not possible in spiral galaxies: there are other galaxies in which they are observed (van der Kruit & Searle 1981; Pohlen et al. 2000), but the Milky Way is not one of them.
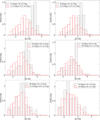 |
Fig. 1 Metallicity distributions [Fe/H] for different subsamples of LAMOST-DR3 K giants with R1 < R < R1 + ΔR, |z| < 5 kpc, and R2 < R < R2 + ΔR, |z| ≥ 5 kpc, respectively, such that ⟨r1⟩≈⟨r2⟩. Normalized such that ∫ d[Fe∕H]P([Fe∕H]) = 1. |
Parameters in the comparison of metallicity distributions [Fe/H] for different subsamples of LAMOST-DR3 giants with R1 < R < R1 + ΔR, |z| < 5 kpc, and R2 < R < R2 + ΔR, |z| ≥ 5 kpc, respectively, such that ⟨r1⟩≈⟨r2⟩.
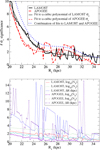 |
Fig. 3 Top: maximum number (choosing the value of ΔR that gives the maximum value) of sigmas of significance detection of different metallicity distributions in the subsamples with R > R1, |z| < 5 kpc, and R > R2, |z| ≥ 5 kpc, respectively, such that ⟨r1⟩≈⟨r2⟩. Bottom: parameters N1, N2, and Δ R corresponding to that detection. |
Acknowledgements
MLC and FGL were supported by the grant AYA2015-66506-P of the Spanish Ministry of Economy and Competitiveness (MINECO). Thanks are given to the anonymous referee for helpful comments and Astrid Peter (language editor of A&A) forthe revision of this paper. Guoshoujing Telescope (the Large Sky Area Multi-Object Fiber Spectroscopic Telescope LAMOST) is a National Major Scientific Project built by the Chinese Academy of Sciences. Funding for the project has been provided by the National Development and Reform Commission. LAMOST is operated and managed by the National Astronomical Observatories, Chinese Academy of Sciences. Funding for the Sloan Digital Sky Survey IV has been provided by the Alfred P. Sloan Foundation, the US Department of Energy Office of Science, and the Participating Institutions. SDSS-IV acknowledges support and resources from the Center for High-Performance Computing at the University of Utah. The SDSS web site is www.sdss.org. SDSS-IV is managed by the Astrophysical Research Consortium for the Participating Institutions of the SDSS Collaboration including the Brazilian Participation Group, the Carnegie Institution for Science, Carnegie Mellon University, the Chilean Participation Group, the French Participation Group, Harvard-Smithsonian Center for Astrophysics, Instituto de Astrofísica de Canarias, The Johns Hopkins University, Kavli Institute forthe Physics and Mathematics of the Universe (IPMU)/University of Tokyo, Lawrence Berkeley National Laboratory, Leibniz Institut für Astrophysik Potsdam (AIP), Max-Planck-Institut für Astronomie (MPIA Heidelberg), Max-Planck-Institut für Astrophysik (MPA Garching), Max-Planck-Institut für Extraterrestrische Physik (MPE), National Astronomical Observatories of China, New Mexico State University, New York University, University of Notre Dame, Observatário Nacional/MCTI, The Ohio State University, Pennsylvania State University, Shanghai Astronomical Observatory, United Kingdom Participation Group, Universidad Nacional Autónoma de México, University of Arizona, University of Colorado Boulder, University of Oxford, University of Portsmouth, University of Utah, University of Virginia, University of Washington, University of Wisconsin, Vanderbilt University, and Yale University.
References
- Abolfathi, B., Aguado, D. S., Aguilar, G., et al. 2018, ApJS, 235, 42 [NASA ADS] [CrossRef] [Google Scholar]
- Allende Prieto, C., Fernández-Alvar, E., Schlesinger, K. J., et al. 2014, A&A, 568, A7 [NASA ADS] [CrossRef] [EDP Sciences] [Google Scholar]
- Amôres, E. B., Robin, A. C., & Reylé, C. 2017, A&A, 602, A67 [NASA ADS] [CrossRef] [EDP Sciences] [Google Scholar]
- Bahcall, J. N., & Soneira, R. M. 1980, ApJS, 44, 73 [NASA ADS] [CrossRef] [Google Scholar]
- Beers, T. C., & Christlieb, N. 2005, ARA&A, 43, 531 [NASA ADS] [CrossRef] [Google Scholar]
- Carlin, J. L., Chao, L., Newberg, H. J., et al. 2015, AJ, 150, 4 [NASA ADS] [CrossRef] [Google Scholar]
- Carraro, G., Vázquez, R. A., Costa, E., Perren, G., & Moitinho, A. 2010, ApJ, 718, 683 [NASA ADS] [CrossRef] [Google Scholar]
- de Vaucouleurs, G., & Pence, W. D. 1978, AJ, 83, 1163 [NASA ADS] [CrossRef] [Google Scholar]
- Feast, M. W., Menzies, J. W., Matsunaga, N., & Whitelock, P. A. 2014, Nature, 509, 342 [NASA ADS] [CrossRef] [PubMed] [Google Scholar]
- Feigelson, E. D., & Babu, G. J. 2012, Modern Statistical Methods for Astronomy with R Applications (Cambridge, UK: Cambridge Univ Press), chapter 3 [CrossRef] [Google Scholar]
- Fernández-Alvar, E., Allende Prieto, C., Schlesinger, K. J., et al. 2015, A&A, 577, A81 [NASA ADS] [CrossRef] [EDP Sciences] [Google Scholar]
- Freudenreich, H. T., Berriman, G. B., Dwek, E., et al. 1994, ApJ, 429, L69 [NASA ADS] [CrossRef] [Google Scholar]
- Garcí a Pérez, A. E., Allende Prieto, C., Holtzman, J. A., et al. 2016, AJ, 151, 144 [NASA ADS] [CrossRef] [Google Scholar]
- Hayden, M. R., Bovy, J., Holtzman, J. A., et al. 2015, ApJ, 808, 132 [NASA ADS] [CrossRef] [Google Scholar]
- Kalberla, P. M. W., & Dedes, L., 2008, A&A, 487, 951 [NASA ADS] [CrossRef] [EDP Sciences] [Google Scholar]
- Liu, C., Deng, L. C., Carlin, J. L., et al., 2014, ApJ, 790, 110 [NASA ADS] [CrossRef] [Google Scholar]
- Liu, C., Xu, Y., Wan, J.-C., et al. 2017, Res. Astron. Astrophys., 17, 96 [Google Scholar]
- López-Corredoira, M., & Molgó, J. 2014, A&A, 567, A106 (LM14) [NASA ADS] [CrossRef] [EDP Sciences] [Google Scholar]
- López-Corredoira, M. Momany, Y. Zaggia, S., & Cabrera-Lavers, A. 2007, A&A, 472, L47 [NASA ADS] [CrossRef] [EDP Sciences] [Google Scholar]
- Majewski, S. R., Schiavon, R. P., Frinchaboy, P. M., et al. 2017, AJ, 154, 94 [NASA ADS] [CrossRef] [Google Scholar]
- McKee, C. F., Parravano, A., & Hollenbach, D. J. 2015, AJ, 814, 13 [NASA ADS] [CrossRef] [Google Scholar]
- Minniti, D., Saito, R. K., Alonso-Garcí a, J., Lucas, P. W., & Hempel, M. 2011, ApJ, 733, L43 [NASA ADS] [CrossRef] [Google Scholar]
- Momany, Y. Zaggia, S. R., Gilmore, G., et al., 2006, A&A, 451, 515 [NASA ADS] [CrossRef] [EDP Sciences] [Google Scholar]
- Nandakumar, G., Schultheis, M., Hayden, M., Rojas-Arriagada, A., Kordopatis, G., & Haywood, M. 2017, A&A, 606, A97 [NASA ADS] [CrossRef] [EDP Sciences] [Google Scholar]
- Pohlen, M., Dettmar, R.-J., & Lütticke, R. 2000, A&A, 357, L1 [NASA ADS] [Google Scholar]
- Porcel, C., Battaner, E., & Jiménez-Vicente, J. 1997, A&A, 322, 103 [NASA ADS] [Google Scholar]
- Reylé, C., Marshall, D. J., Robin, A. C., & Schultheis, M. 2009, A&A, 495, 819 [NASA ADS] [CrossRef] [EDP Sciences] [Google Scholar]
- Ruphy, S., Robin, A. C., Epchtein, N., et al. 1996, A&A, 313, L21 [NASA ADS] [Google Scholar]
- Sale, S. E., Drew, J. E., Knigge, C., et al. 2010, MNRAS, 402, 713 [NASA ADS] [CrossRef] [Google Scholar]
- Santiago, B. X., Brauer, D. E., Anders, F., et al. 2016, A&A, 585, A42 [NASA ADS] [CrossRef] [EDP Sciences] [Google Scholar]
- Schultheis, M., Zasowski, G., Allende-Prieto, C., et al. 2014, AJ, 148, 24 [NASA ADS] [CrossRef] [Google Scholar]
- van der Kruit,P. C., & Searle, L. 1981, A&A, 95, 105 [NASA ADS] [Google Scholar]
- Xu, Y., Liu, C., Xue, X.-X., et al. 2017, MNRAS, 473, 1244 [NASA ADS] [CrossRef] [Google Scholar]
- Wang, J., Shi, J., Pan, K., Chen, B., Zhao, Y., & Wicker, J. 2016, MNRAS, 460, 3179 [NASA ADS] [CrossRef] [Google Scholar]
- Wang, Q., Wang, Y., Liu, C., Mao, S., & Long, R. J. 2017, MNRAS, 470, 2949 [NASA ADS] [CrossRef] [Google Scholar]
All Tables
Parameters in the comparison of metallicity distributions [Fe/H] for different subsamples of LAMOST-DR3 giants with R1 < R < R1 + ΔR, |z| < 5 kpc, and R2 < R < R2 + ΔR, |z| ≥ 5 kpc, respectively, such that ⟨r1⟩≈⟨r2⟩.
All Figures
|
Fig. 1 Metallicity distributions [Fe/H] for different subsamples of LAMOST-DR3 K giants with R1 < R < R1 + ΔR, |z| < 5 kpc, and R2 < R < R2 + ΔR, |z| ≥ 5 kpc, respectively, such that ⟨r1⟩≈⟨r2⟩. Normalized such that ∫ d[Fe∕H]P([Fe∕H]) = 1. |
| In the text | |
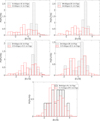 |
Fig. 2 Same as Fig. 1 for SDSS-APOGEE-DR14 stars. |
| In the text | |
|
Fig. 3 Top: maximum number (choosing the value of ΔR that gives the maximum value) of sigmas of significance detection of different metallicity distributions in the subsamples with R > R1, |z| < 5 kpc, and R > R2, |z| ≥ 5 kpc, respectively, such that ⟨r1⟩≈⟨r2⟩. Bottom: parameters N1, N2, and Δ R corresponding to that detection. |
| In the text | |
Current usage metrics show cumulative count of Article Views (full-text article views including HTML views, PDF and ePub downloads, according to the available data) and Abstracts Views on Vision4Press platform.
Data correspond to usage on the plateform after 2015. The current usage metrics is available 48-96 hours after online publication and is updated daily on week days.
Initial download of the metrics may take a while.