Fig. 8
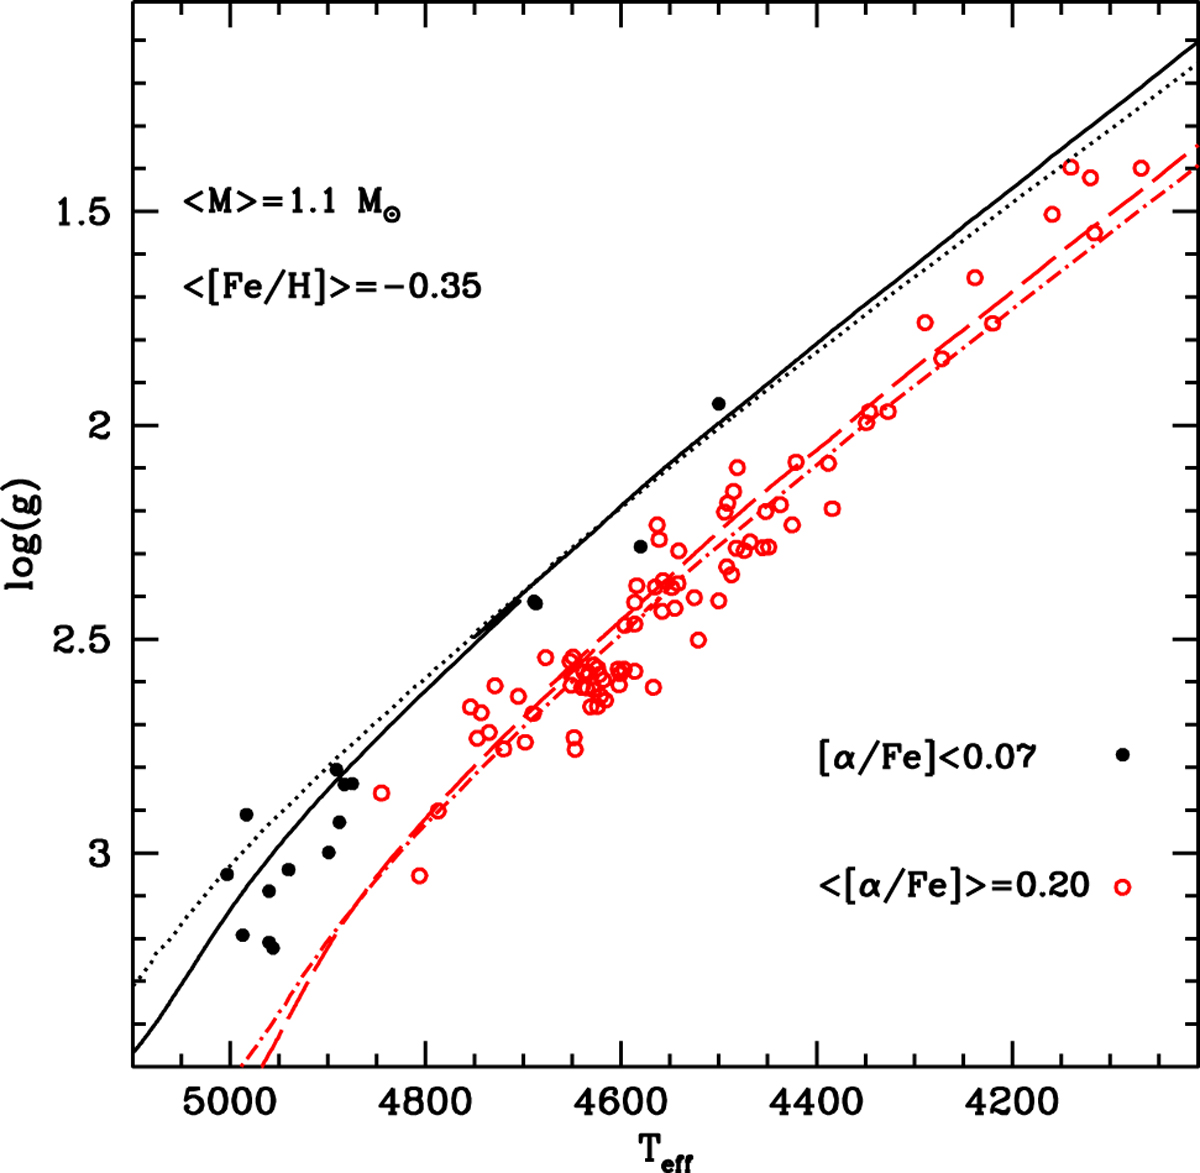
log(g)–Teff diagram of two sub-samples of APOKASC RGB stars with average [Fe/H]=-0.35 and mass 1.1 M⊙, but different α–enhancements: scaled solar objects ([α/Fe] < 0.07, filled circles) and α–enhanced (average [α∕Fe] = 0.2, open circles). Our 1.1 M⊙, [Fe/H] = −0.35 evolutionarytracks for [α∕Fe] = 0 (solid line) and + 0.40 (dashed line) are also displayed. The α-enhancement of the theoretical models is twice the average enhancement of the selected α-enhanced stars. Dotted and dot-dashed lines show tracks with the same mass, [Fe/H] and α-enhancements, from Dotter et al. (2008).
Current usage metrics show cumulative count of Article Views (full-text article views including HTML views, PDF and ePub downloads, according to the available data) and Abstracts Views on Vision4Press platform.
Data correspond to usage on the plateform after 2015. The current usage metrics is available 48-96 hours after online publication and is updated daily on week days.
Initial download of the metrics may take a while.