Free Access
Fig. 3
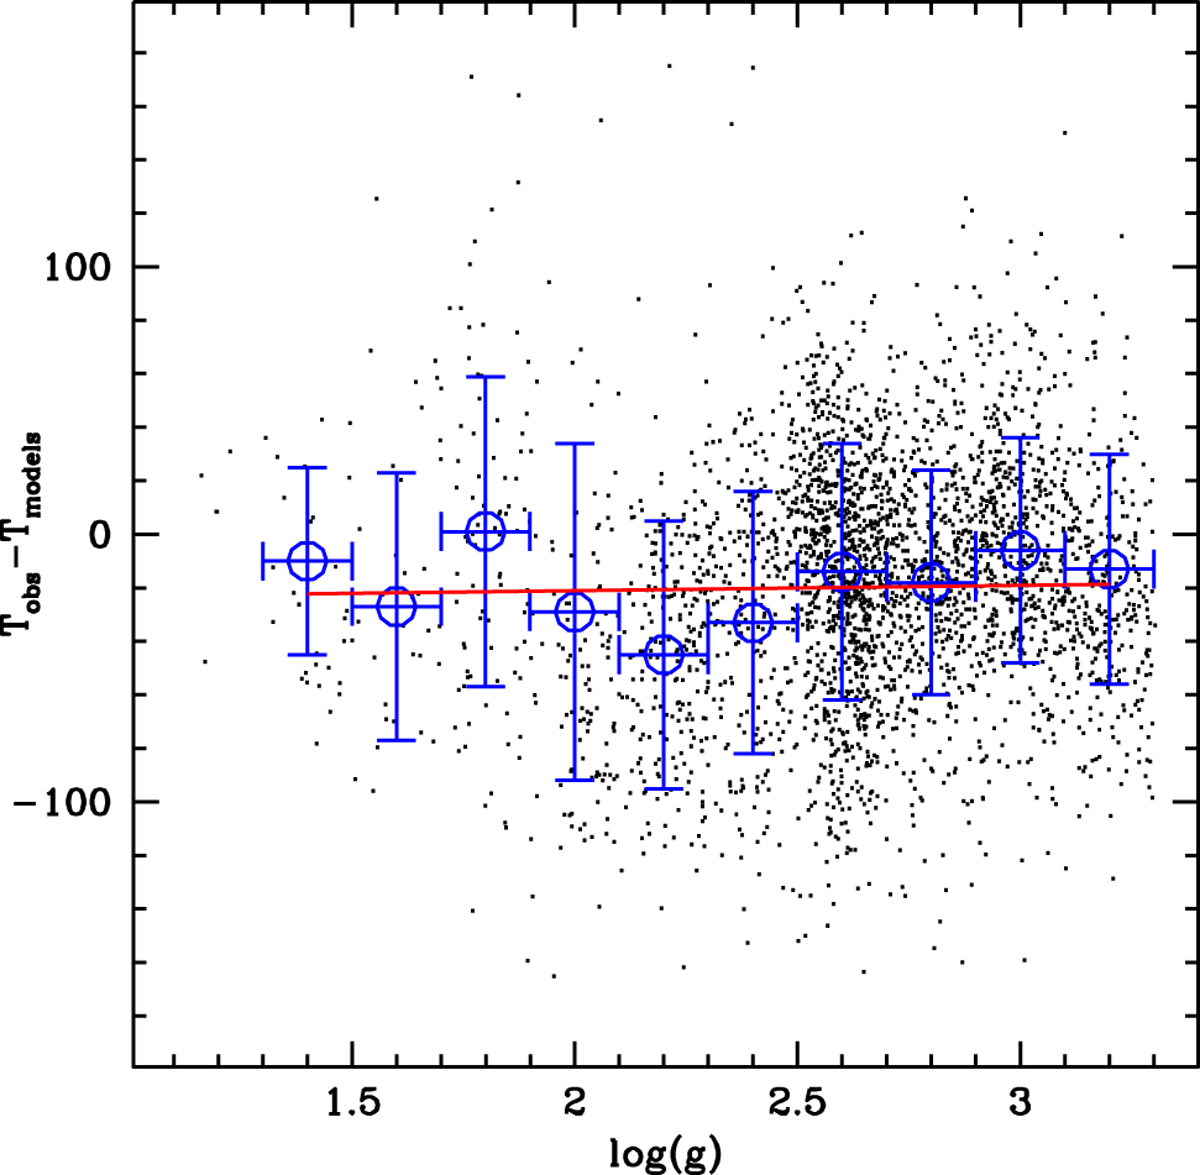
ΔT as a functionof log(g) for the whole sample of RGB stars. Open circles with error bars denote the mean values of ΔT in 0.2 dex log(g) bins, and the1σ dispersion around these mean values. The solid line displays a linear fit to the binned data, with a slope that is consistent with zero (the slope is equal to 2 ± 8 K/dex).
Current usage metrics show cumulative count of Article Views (full-text article views including HTML views, PDF and ePub downloads, according to the available data) and Abstracts Views on Vision4Press platform.
Data correspond to usage on the plateform after 2015. The current usage metrics is available 48-96 hours after online publication and is updated daily on week days.
Initial download of the metrics may take a while.