Fig. 6
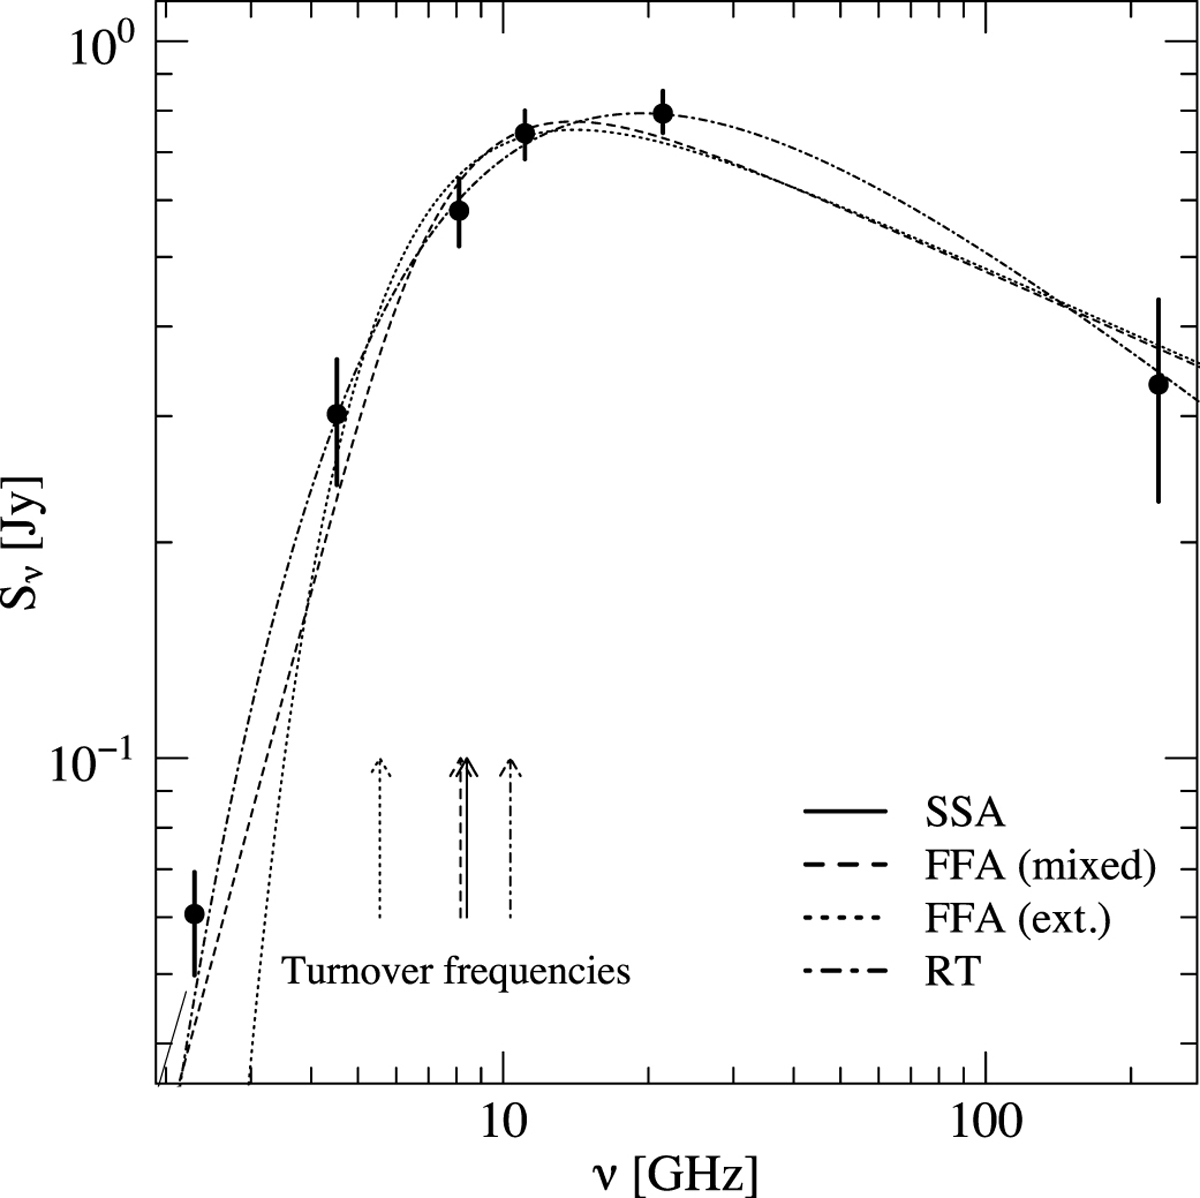
Quasi-simultaneous radio spectrum from RATAN-600 (2–22 GHz; the data in all bands was taken simultaneously on MJD 57631.8) and SMA (230 GHz; the data was taken on MJD 57631.2). The data point for the SMA is an average over the 1.5 hour exposure and the error bars indicate the standard deviation of the measurements during the exposure. The spectrum is fitted with several models (SSA: synchroton self-absorption, FFA: free-free absorption, RT: Razin-Tsytovitch effect). See text for more details.
Current usage metrics show cumulative count of Article Views (full-text article views including HTML views, PDF and ePub downloads, according to the available data) and Abstracts Views on Vision4Press platform.
Data correspond to usage on the plateform after 2015. The current usage metrics is available 48-96 hours after online publication and is updated daily on week days.
Initial download of the metrics may take a while.