Fig. 4
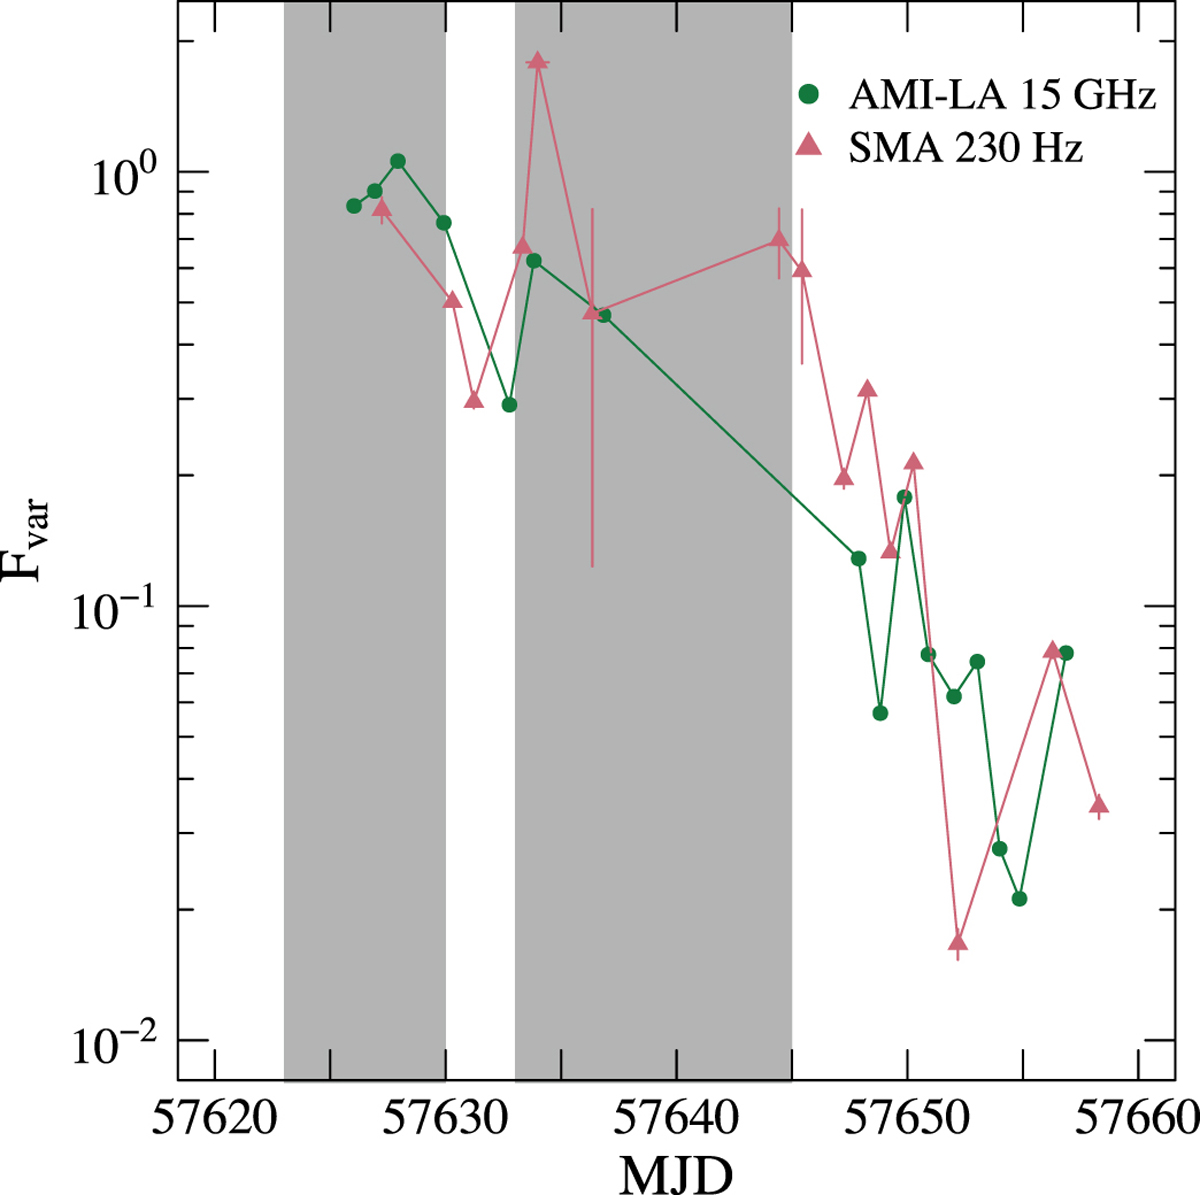
Fractional variability amplitude (coefficient of variation) of the radio light curves (green: 15 GHz, red: 230 GHz). The evolution in the 15 GHz and 230 GHz is similar. Also, during the hypersoft state (around MJD 57625 and MJD 57635, colored areas) the fractional variability amplitude is at maximum and presenting variations exceeding the mean, while during the flares it is markedly lower.
Current usage metrics show cumulative count of Article Views (full-text article views including HTML views, PDF and ePub downloads, according to the available data) and Abstracts Views on Vision4Press platform.
Data correspond to usage on the plateform after 2015. The current usage metrics is available 48-96 hours after online publication and is updated daily on week days.
Initial download of the metrics may take a while.