Fig. 2
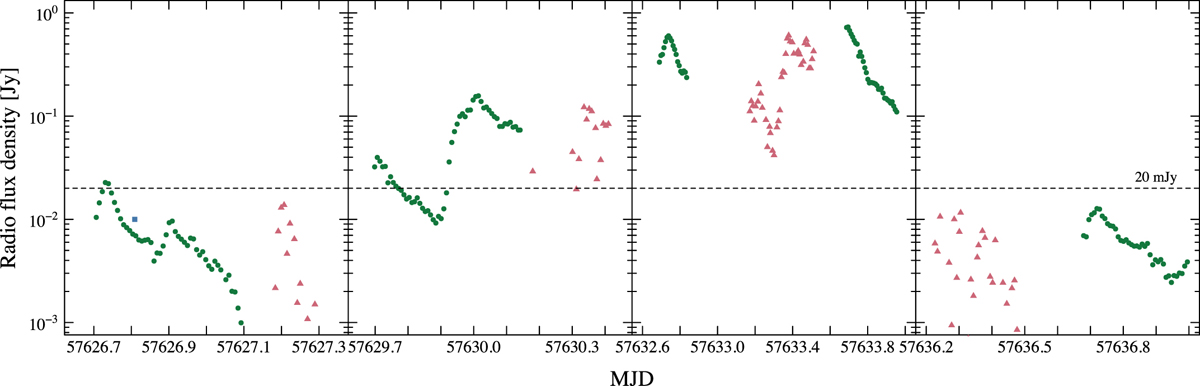
Intraday radio light curves (green: 15 GHz, red: 230 GHz) from the 2016 hypersoft state (first and last panels) and minor radio flare (middle panels). The colors are same as in Fig. 1. The 230 GHz light curve seems to present higher variability (see Figs. 3 and 4). The 15 GHz light curve presents some well-defined flares that last ~0.1 days, indicating a size scale of 3 × 1014 cm (well beyond the orbital scale).
Current usage metrics show cumulative count of Article Views (full-text article views including HTML views, PDF and ePub downloads, according to the available data) and Abstracts Views on Vision4Press platform.
Data correspond to usage on the plateform after 2015. The current usage metrics is available 48-96 hours after online publication and is updated daily on week days.
Initial download of the metrics may take a while.