Fig. 11
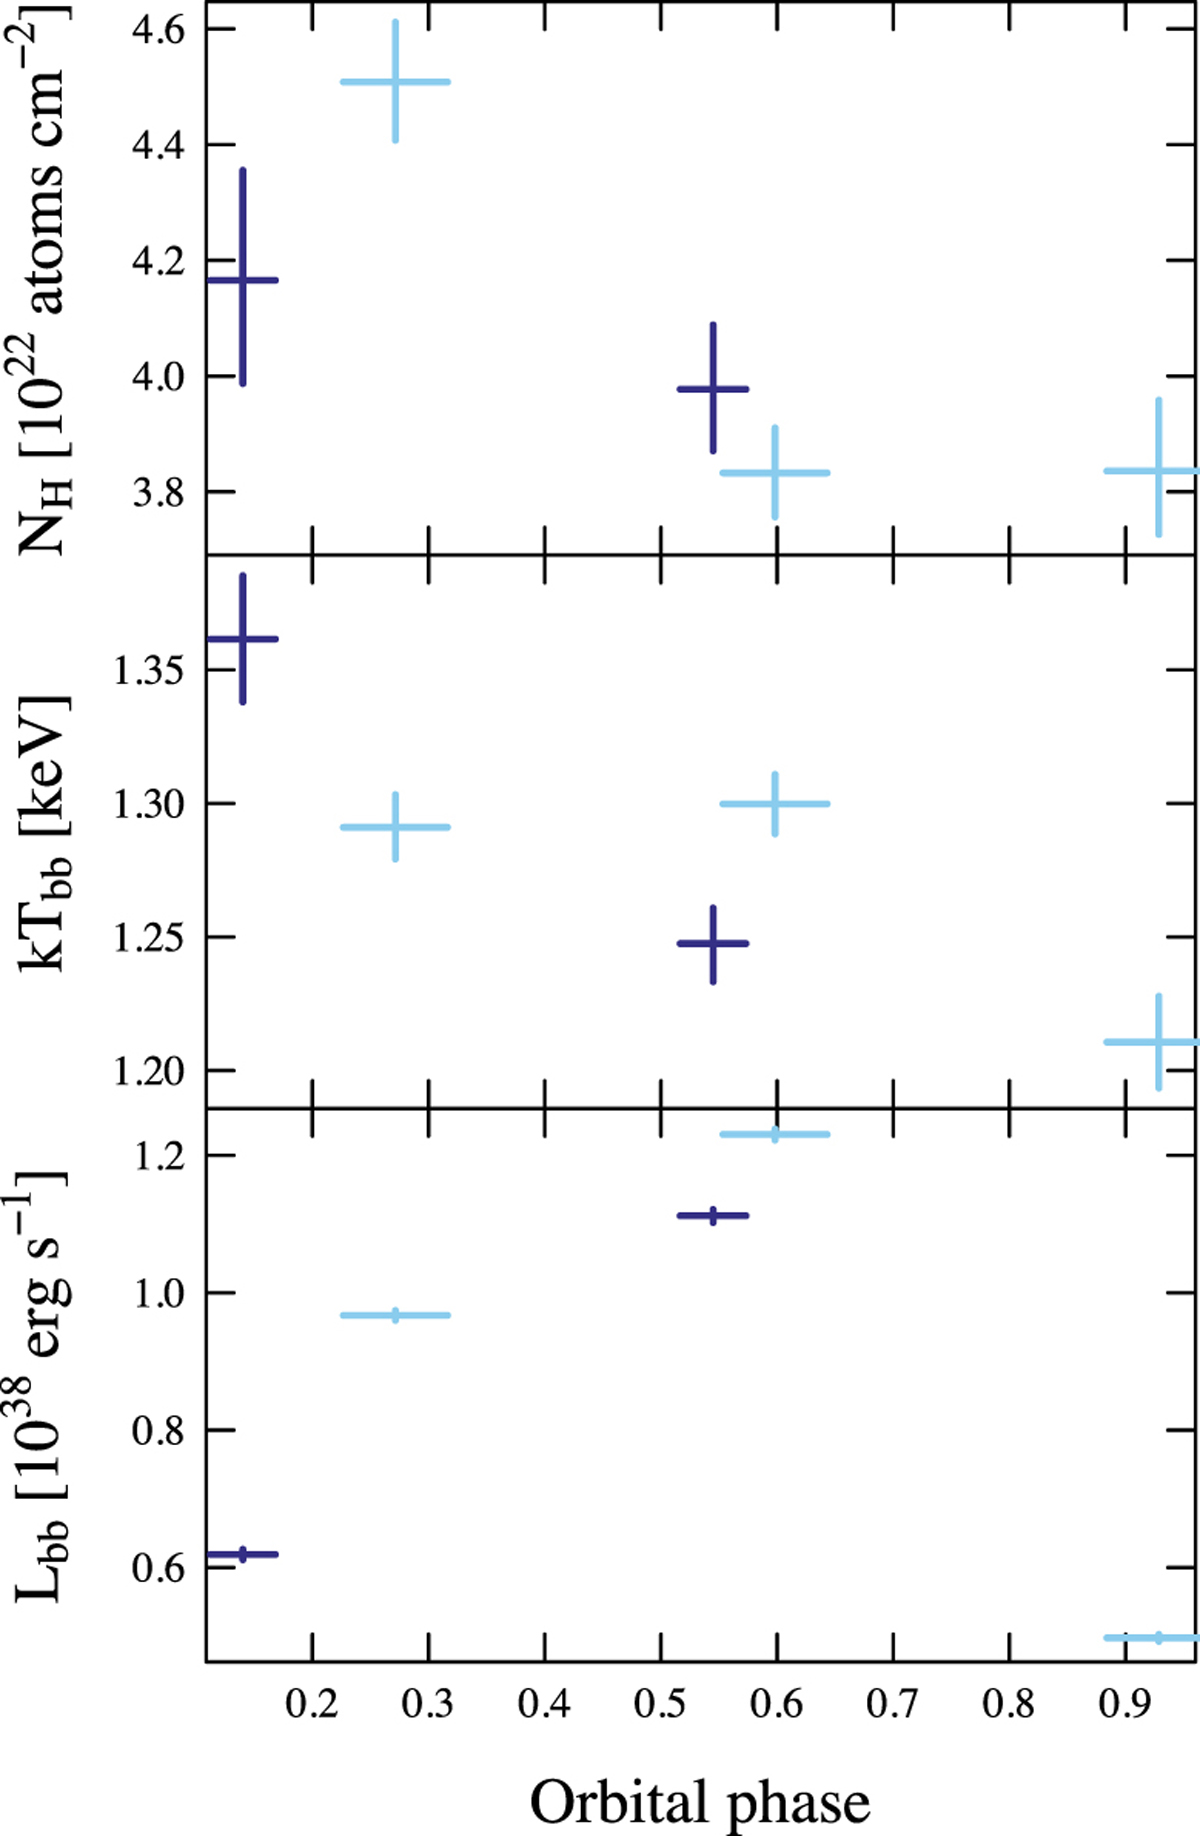
X-ray model parameter evolution over the orbital phase using the Swift data. The various colors indicate the different times: blue corresponds to the observations taken in 2016 and light blue in 2017. From top to bottom: hydrogen column density, temperature of the blackbody, and bolometric blackbody luminosity assuming a distance of 7.4 kpc are shown.
Current usage metrics show cumulative count of Article Views (full-text article views including HTML views, PDF and ePub downloads, according to the available data) and Abstracts Views on Vision4Press platform.
Data correspond to usage on the plateform after 2015. The current usage metrics is available 48-96 hours after online publication and is updated daily on week days.
Initial download of the metrics may take a while.