Fig. A.1
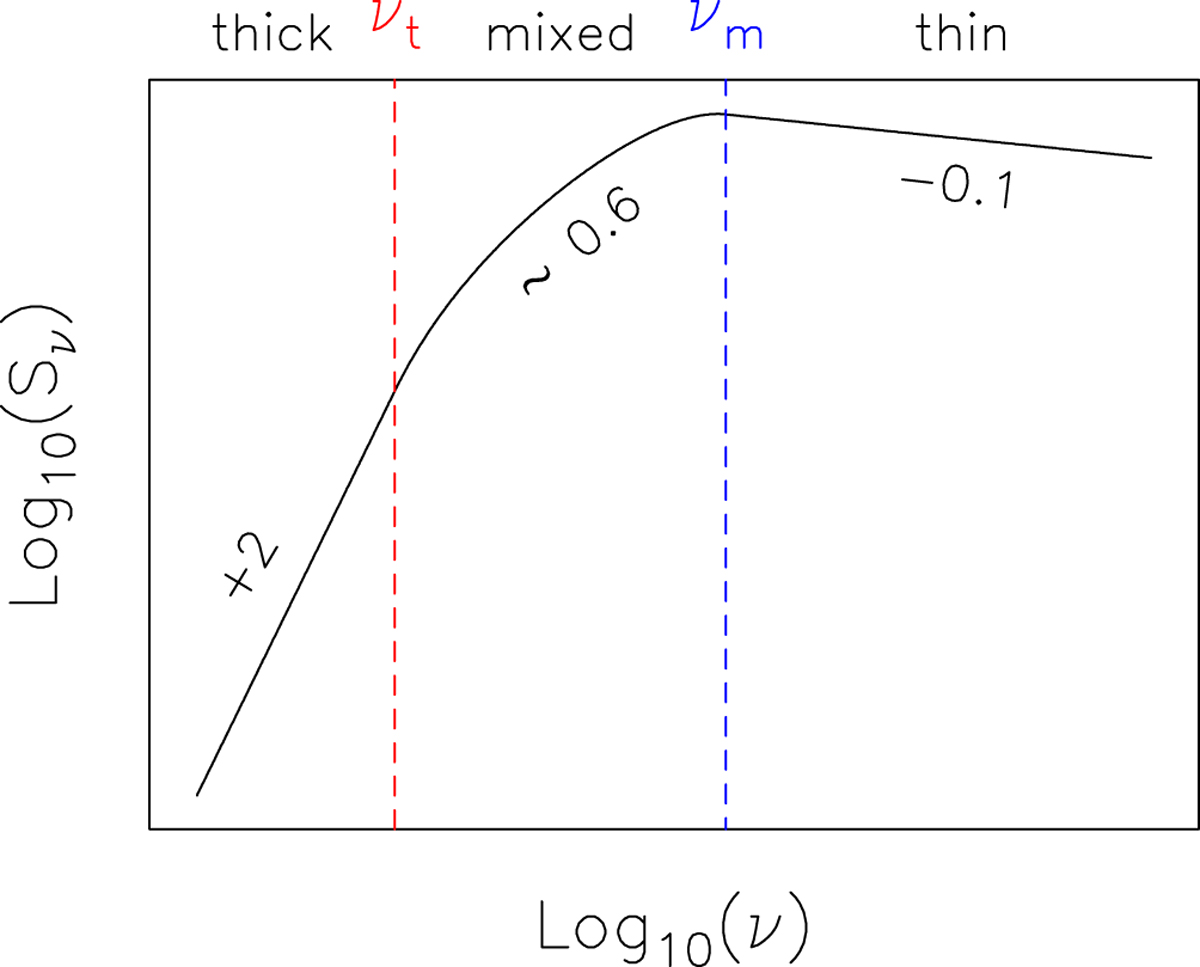
Schematic radio continuum spectrum of a typical thermal jet. The two turn-over frequencies at the border of the optically thick and thin regions of the spectrum are indicated at the top of the figure. The regime between the two frequencies is characterized by a mixture of thin and thick emission. The numbers indicate the slopes in the three parts of the spectrum; 0.6 refers to the simple case adopted by us.
Current usage metrics show cumulative count of Article Views (full-text article views including HTML views, PDF and ePub downloads, according to the available data) and Abstracts Views on Vision4Press platform.
Data correspond to usage on the plateform after 2015. The current usage metrics is available 48-96 hours after online publication and is updated daily on week days.
Initial download of the metrics may take a while.