Fig. 5
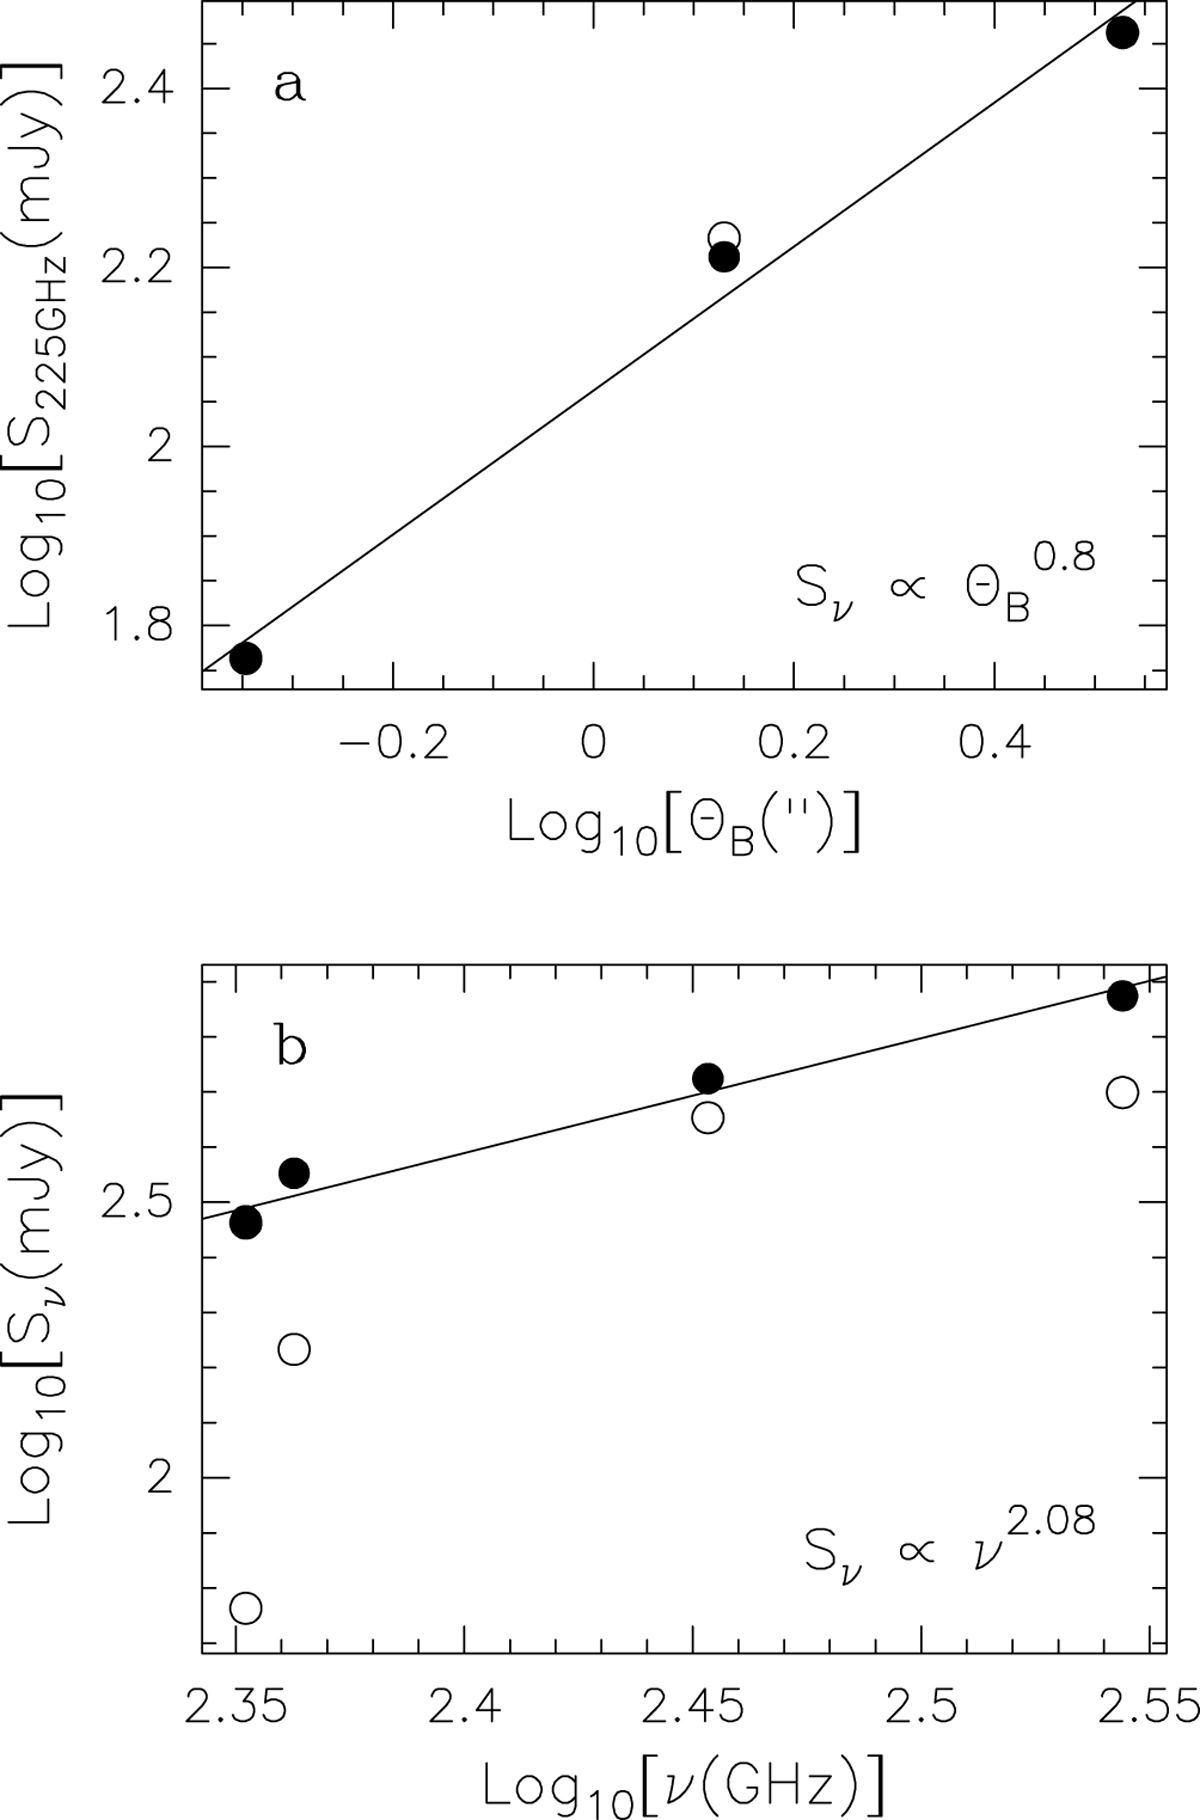
Panel a: Flux densities at 225 GHz and 230 GHz from Table 2 versus the full width at half power of the corresponding synthesized beam. The 230 GHz flux (empty point) has been scaled to 225 GHz (solid point) assuming Sν ∝ ν2. The straight line is the linear fit (in the logarithmic plot) to the solid points, based on Eq. (3). Panel b: Flux densities from Table 2 as a function of frequency before (empty points) and after (solid points) scaling the fluxes to an angular resolution of 3.′′ 37 (see text) with Eq. (3). The straight line is the linear fit (in the logarithmic plot) to the solid points, based on Eq. (4).
Current usage metrics show cumulative count of Article Views (full-text article views including HTML views, PDF and ePub downloads, according to the available data) and Abstracts Views on Vision4Press platform.
Data correspond to usage on the plateform after 2015. The current usage metrics is available 48-96 hours after online publication and is updated daily on week days.
Initial download of the metrics may take a while.