Free Access
Fig. 6
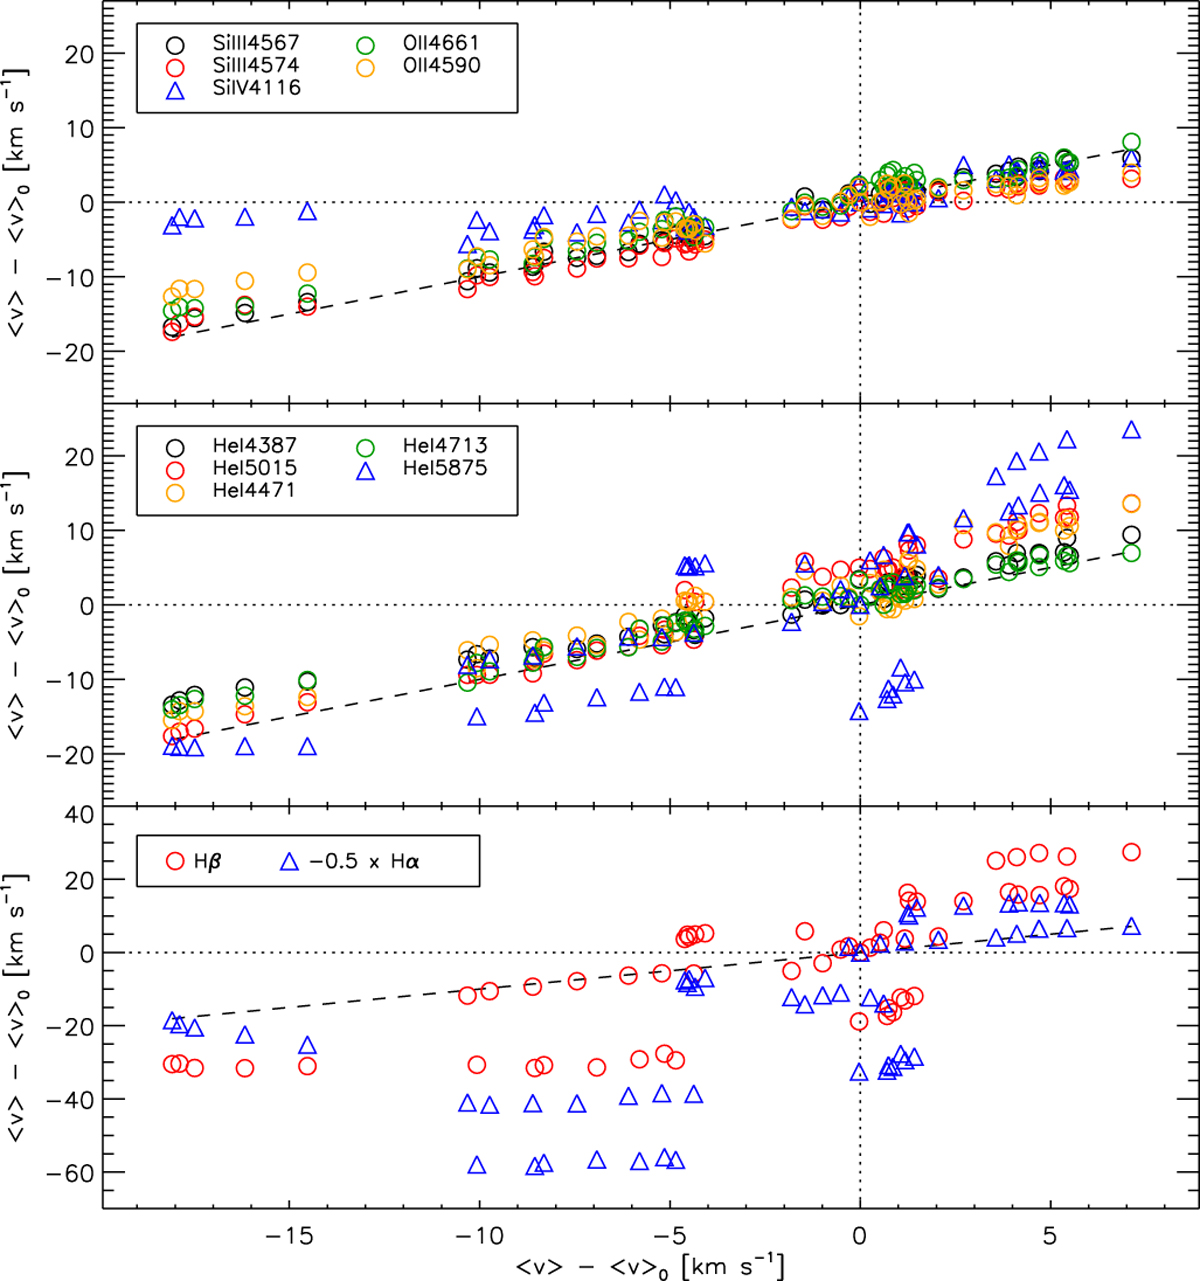
Correlations in the temporal variability of the first moment (centroid) of 13 diagnostic lines in HD 2905. The Si III λ4552 line is used as baseline (x-axis) and all measurements are referred to the value of ⟨v⟩ (per individual line) corresponding to the first spectrum in the HERMES-2 dataset (see also Table 1 and Fig. 7).
Current usage metrics show cumulative count of Article Views (full-text article views including HTML views, PDF and ePub downloads, according to the available data) and Abstracts Views on Vision4Press platform.
Data correspond to usage on the plateform after 2015. The current usage metrics is available 48-96 hours after online publication and is updated daily on week days.
Initial download of the metrics may take a while.