Fig. 3
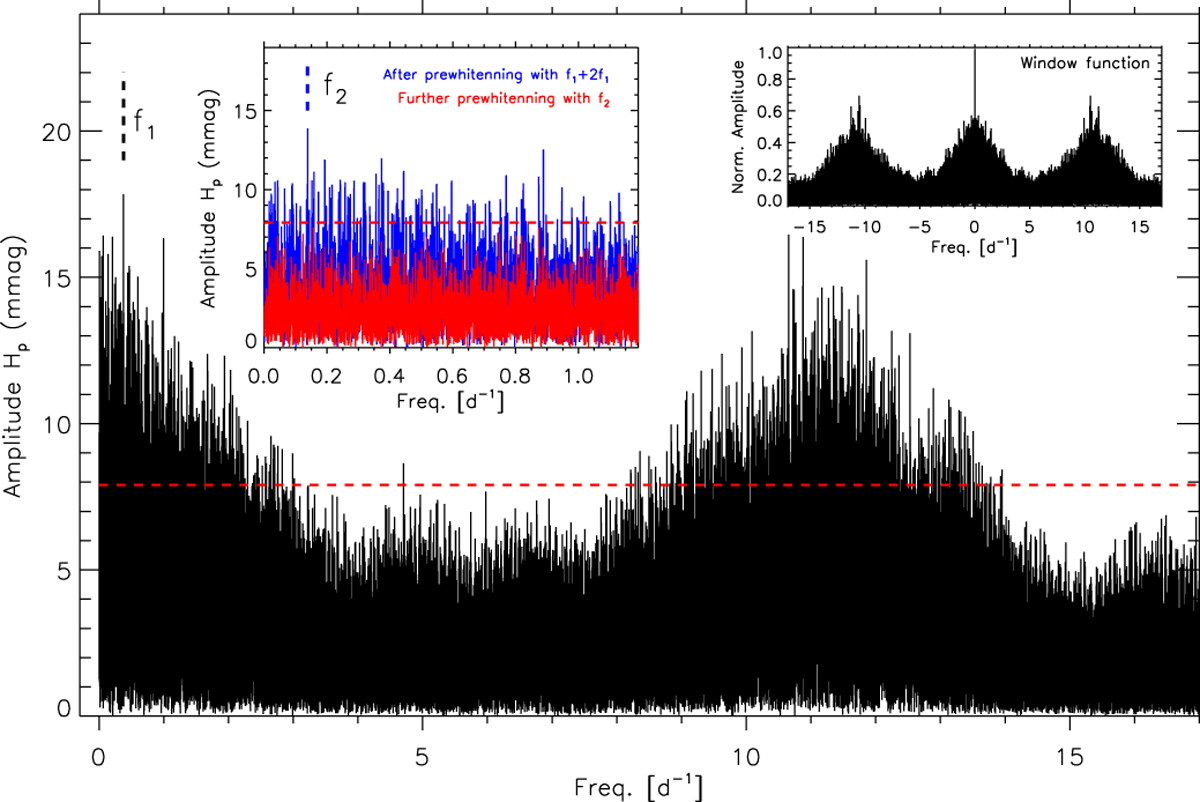
Amplitude spectrum of the hipparcos light curve of HD 2905, where the dominant frequency peak (f1 ) is also indicated. The right inset represents the spectral window. The left inset is a zoom of the amplitude spectrum showing two subsequent levels of prewhitening and the only additional reliable frequency peak (f2 ) standing out above four times the average noise level, indicated by the horizontal red dashed line (see text for details).
Current usage metrics show cumulative count of Article Views (full-text article views including HTML views, PDF and ePub downloads, according to the available data) and Abstracts Views on Vision4Press platform.
Data correspond to usage on the plateform after 2015. The current usage metrics is available 48-96 hours after online publication and is updated daily on week days.
Initial download of the metrics may take a while.