Fig. 13
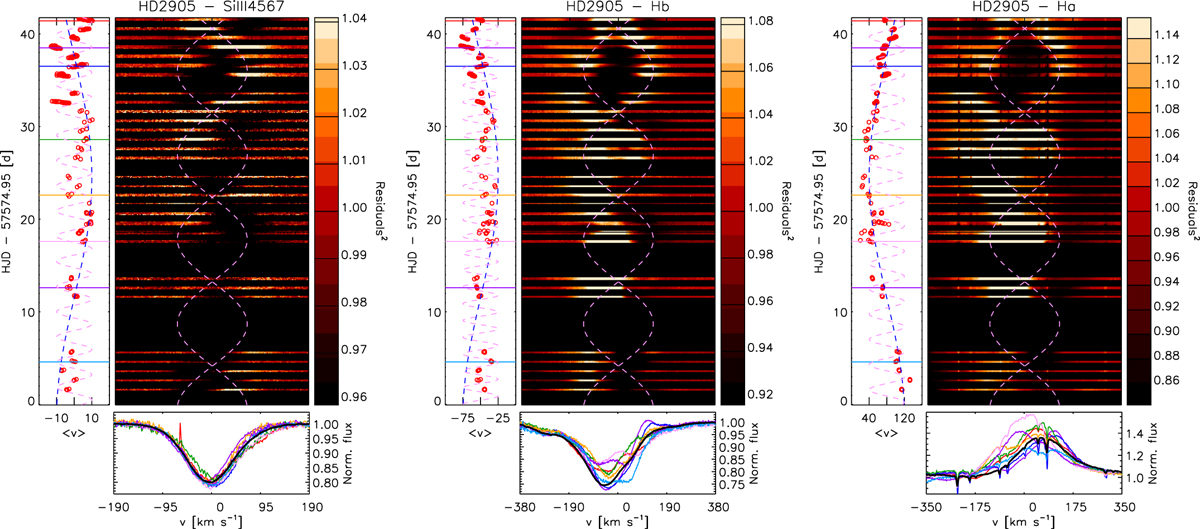
Temporal distribution of residuals in λ-space for three representative line profiles in HD 2905. (Left) Si III λ4567 as an example of a purely photospheric line. (Right) Hα as the most extreme case of optical line affected by stellar wind. (Middle) Hβ as an intermediate case. We also include for reference purposes three sinusoidal curves with associated frequencies 0.055 d−1 (pink), 0.019d−1 (blue), and 0.369 d−1 (purple), respectively (see Sect. 4.2.3 for discussion). Panels to the left show the temporal variation of the centroid of each line-profile (⟨v⟩). Bottom panels include several individual profiles corresponding to the dates indicated as horizontal lines in the left panels, as well as the mean profile obtained from the complete FIES+HERMES+SONG spectroscopic dataset.
Current usage metrics show cumulative count of Article Views (full-text article views including HTML views, PDF and ePub downloads, according to the available data) and Abstracts Views on Vision4Press platform.
Data correspond to usage on the plateform after 2015. The current usage metrics is available 48-96 hours after online publication and is updated daily on week days.
Initial download of the metrics may take a while.