Fig. 12
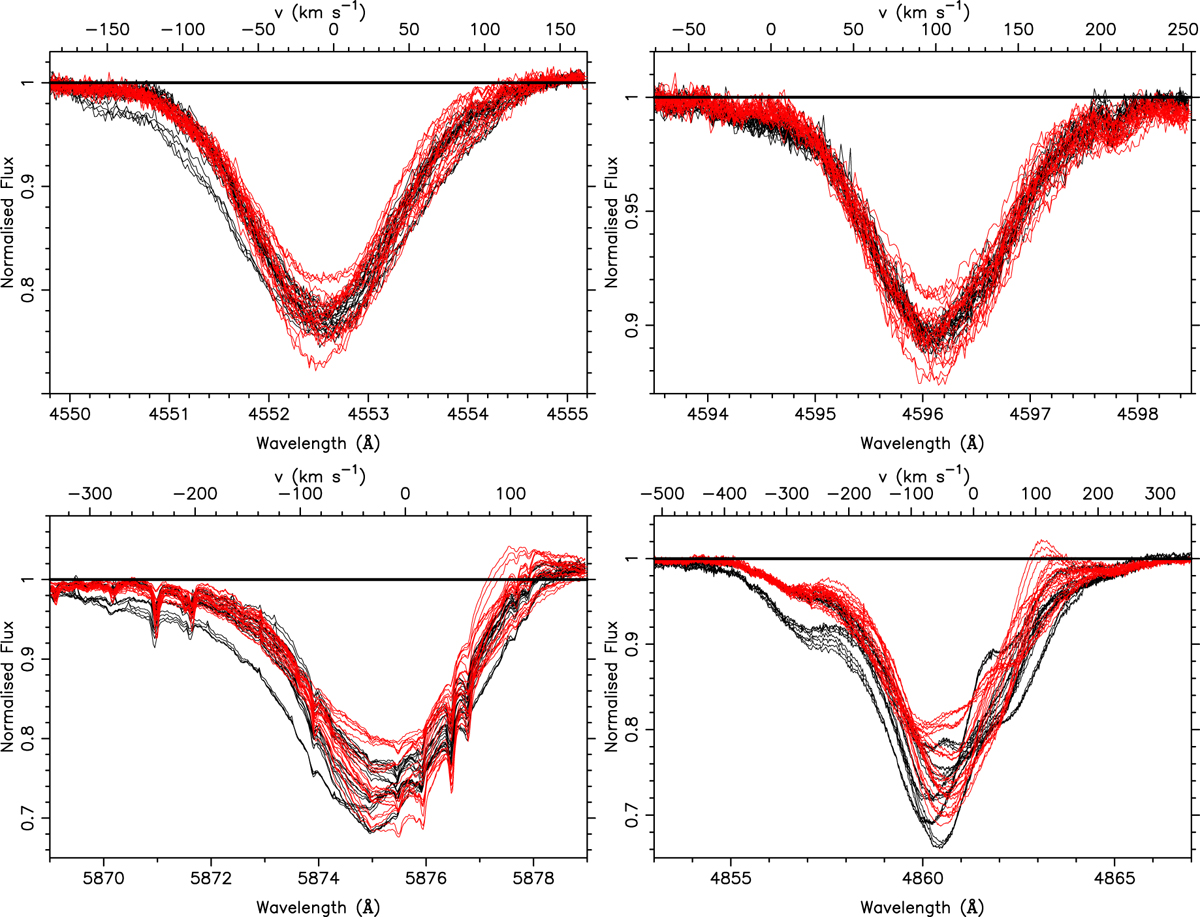
Line profiles averaged over 16 individual consecutive measurements of the SONG spectroscopy of the first (black) and second (red) intensive campaigns. The top two panels are for photospheric lines (left: Si III, right: O II) while the bottom two panels are for lines affected by the stellar wind (left: He I with sharp dips caused by telluric lines, right: Hβ ).
Current usage metrics show cumulative count of Article Views (full-text article views including HTML views, PDF and ePub downloads, according to the available data) and Abstracts Views on Vision4Press platform.
Data correspond to usage on the plateform after 2015. The current usage metrics is available 48-96 hours after online publication and is updated daily on week days.
Initial download of the metrics may take a while.