Fig. 10
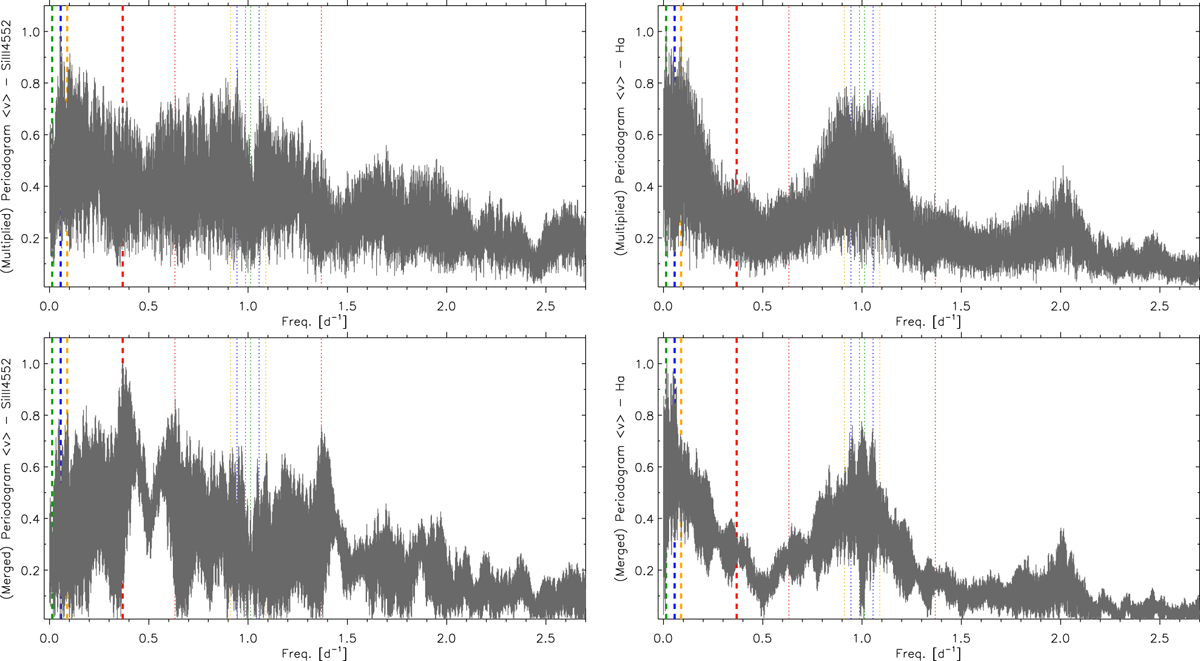
Multiplied Scargle periodograms (top panels) of all three individual FIES, HERMES, and SONG datasets, after rescaling each one of them to their dominant frequency (see text), compared with the periodogram of the merged dataset (bottom panels) for the first moment of the Si III λ4552 (left) and Hα (right) lines.Thick dashed lines indicate some of the dominant frequencies identified in any of the four periodograms. Thin dotted lines show their ±1 day aliases.
Current usage metrics show cumulative count of Article Views (full-text article views including HTML views, PDF and ePub downloads, according to the available data) and Abstracts Views on Vision4Press platform.
Data correspond to usage on the plateform after 2015. The current usage metrics is available 48-96 hours after online publication and is updated daily on week days.
Initial download of the metrics may take a while.