Fig. 2
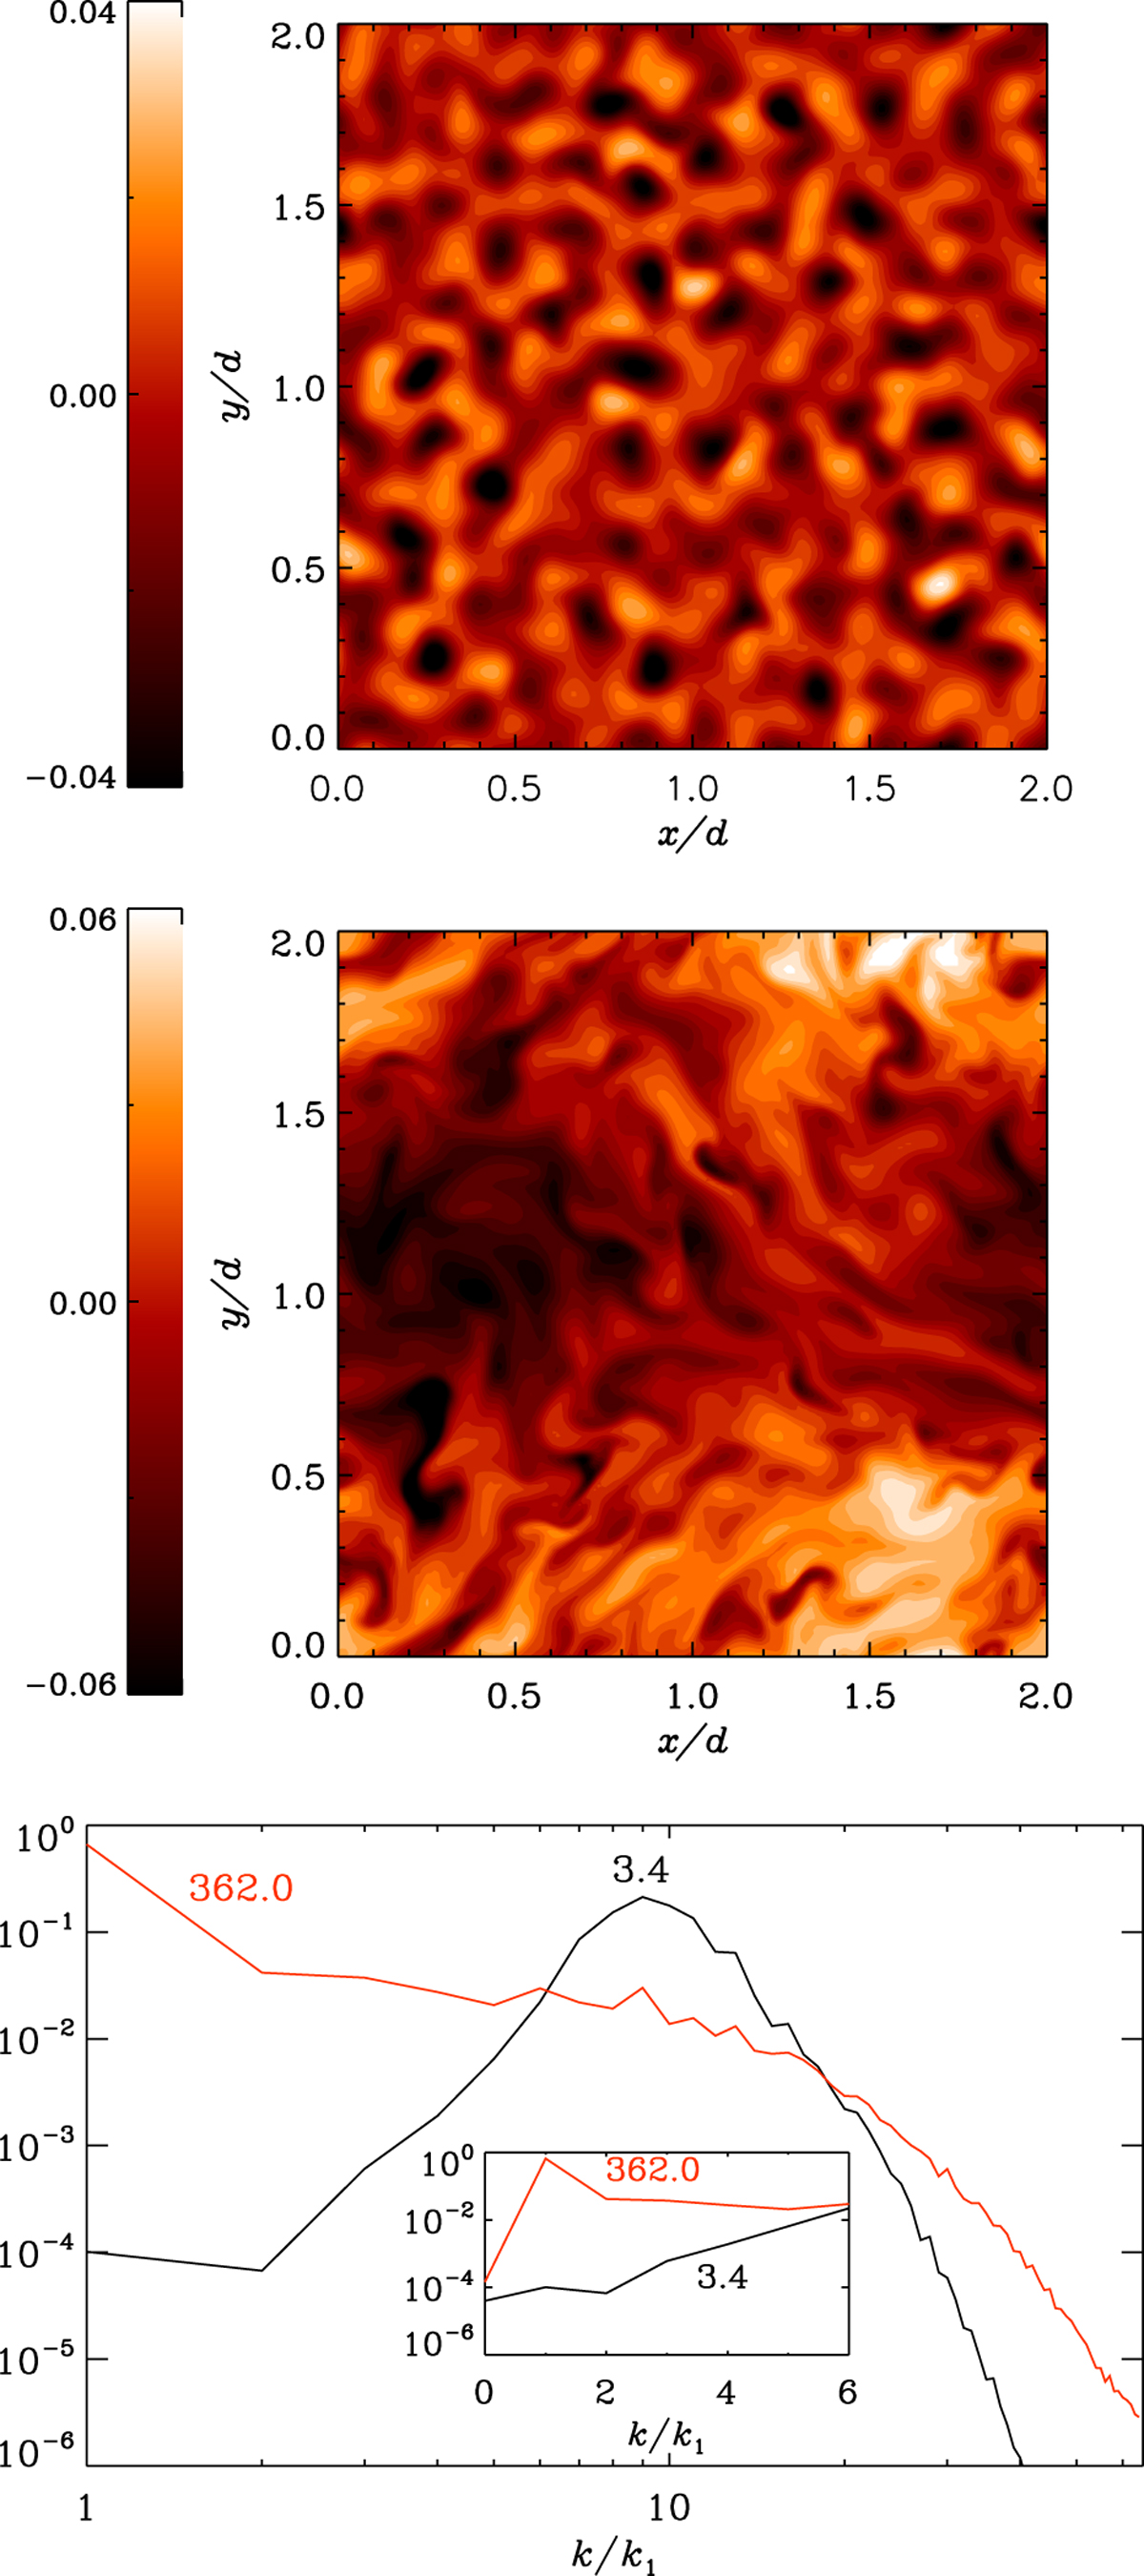
Early stages of the reference solution. Mid-layer temperature distributions (at zm) at times turmskf = 3.4 (top) and turmskf = 362.0 (middle), plotted as functions of x and y. In each plot, the mid-layer temperature is normalised by its mean value (horizontally averaged), with the contours showing the deviations from the mean. Bottom: mid-layer kinetic energy spectra at the same times, normalised by the average kinetic energy at zm at each time. Here k is the horizontal wavenumber (in the x direction), whilst k1 = 2π∕λ is the fundamental mode. The inset highlights the low wavenumber behaviour, using a non-logarithmic abscissa to include k∕k1 = 0.
Current usage metrics show cumulative count of Article Views (full-text article views including HTML views, PDF and ePub downloads, according to the available data) and Abstracts Views on Vision4Press platform.
Data correspond to usage on the plateform after 2015. The current usage metrics is available 48-96 hours after online publication and is updated daily on week days.
Initial download of the metrics may take a while.