Fig. 9
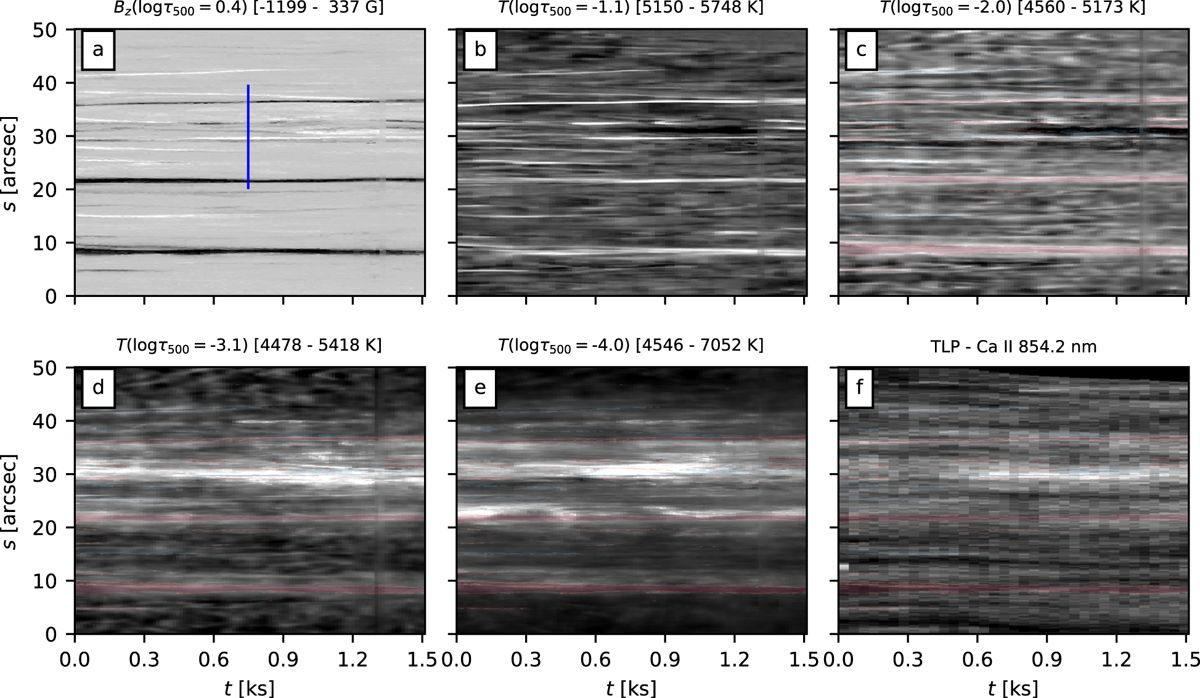
Results from the non-LTE inversion of the Ca II K , Fe I, and Ca II 854.2 nm lines in a time-slice indicated by the diagonal linein panel d of Fig. 1. The upper left panel shows the vertical magnetic field in the photosphere, while the panel c–f show the inferred temperature at different 500 nm continuum optical depths, as specified above each panel. Panel f shows the total linear polarization signal in the Ca II 854.2 nm line. The brightness of each panel is clipped at the brightest and darkest 0.5% of the pixels. The range of the colour scales is indicated between square brackets. Panels c–f show the photospheric magnetic field in semi-transparent red and blue for comparison. The overlap with the xy-region shown in Fig. 8 is indicated by the blue line in the upper left panel.
Current usage metrics show cumulative count of Article Views (full-text article views including HTML views, PDF and ePub downloads, according to the available data) and Abstracts Views on Vision4Press platform.
Data correspond to usage on the plateform after 2015. The current usage metrics is available 48-96 hours after online publication and is updated daily on week days.
Initial download of the metrics may take a while.