Fig. 7
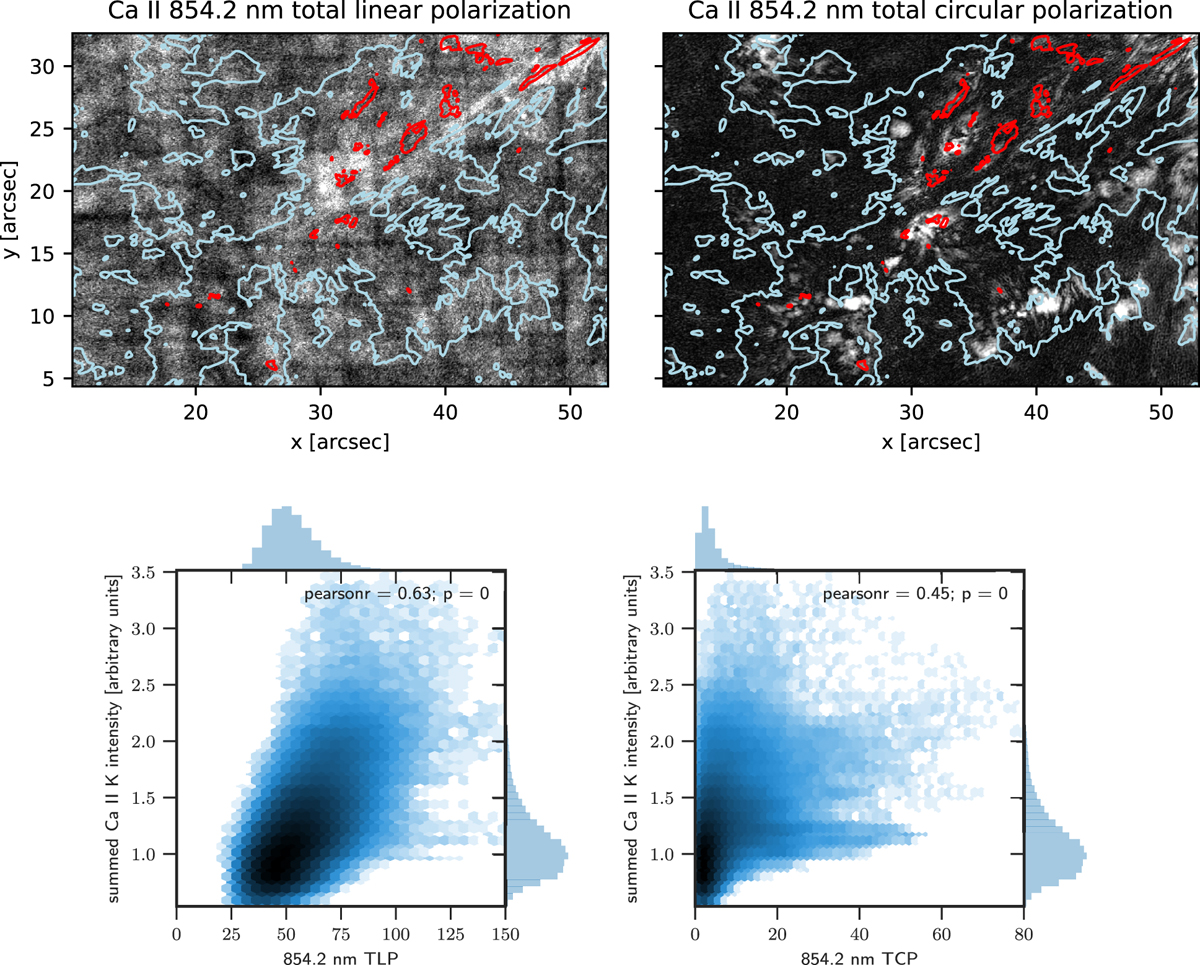
Ca II K summed intensity and polarization signal in Ca II 854.2 nm at 09:44 UT. Upper panels: maps of the total linear and circular polarization in the Ca II 854.2 nm line with the wavelength-summed Ca II K brightness contours defined in Sect. 3.1 overplotted. The brightness range of the images has been clipped to enhance contrast. Lower panels: joint probability distributions of the total linear and circular polarization in the Ca II 854.2 nm line and the wavelength-summed Ca II K intensity computed from the data shown in the upper panels. The Pearson correlation coefficient r and the p value are indicated at the top of both panels. The colour of the hexagons is proportional to the logarithm of the number of points in each bin, with darker colour indicating more points.
Current usage metrics show cumulative count of Article Views (full-text article views including HTML views, PDF and ePub downloads, according to the available data) and Abstracts Views on Vision4Press platform.
Data correspond to usage on the plateform after 2015. The current usage metrics is available 48-96 hours after online publication and is updated daily on week days.
Initial download of the metrics may take a while.