Fig. 6
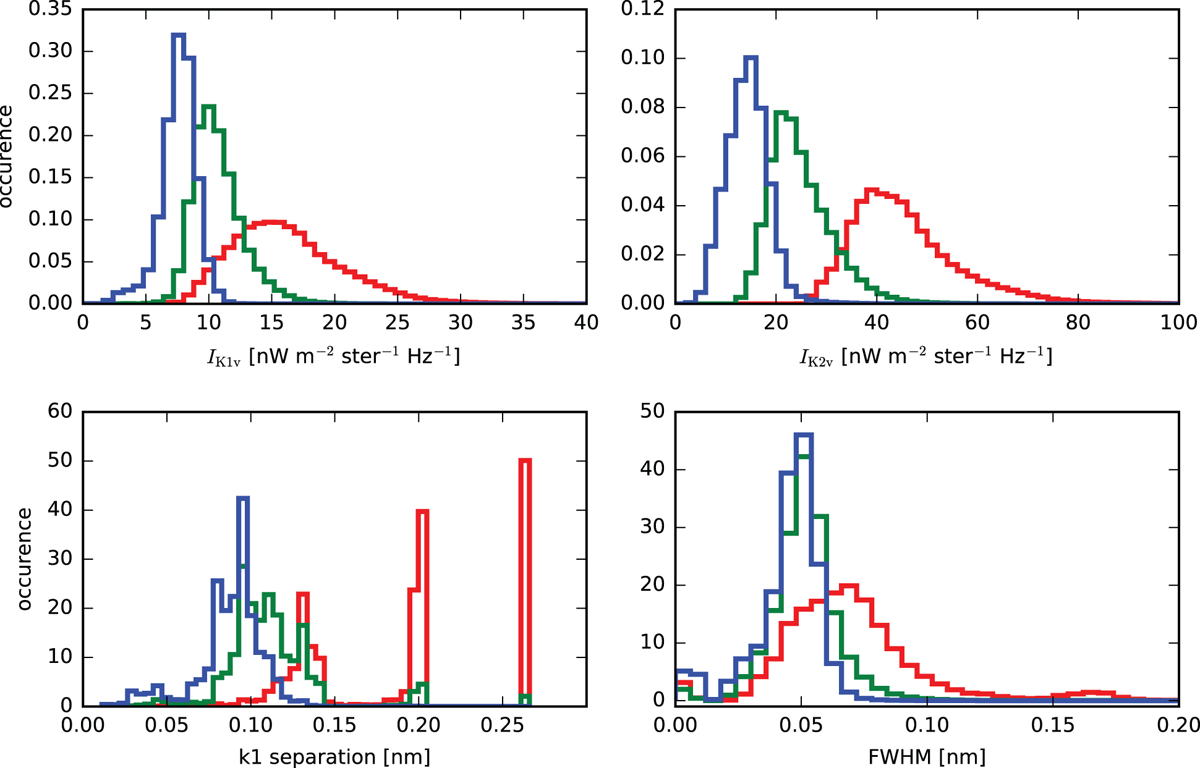
Histograms of Ca II K line profile features per brightness bin. Blue: low brightness; green: intermediate brightness; red: high brightness. Upper left: intensity of the K1v feature. Upper right: intensity of the K2v features. Lower left: λK1r − λK1v, the wavelength separation between the K1 minima. The three-peaked structure of the green and red distributions are caused by the sparse wavelength sampling furthest away from the line core. Lower right: the full-width at half maximum of the emission peak between the K1 minima. The histograms are normalised so that the sum of all bins times the bin width adds up to one.
Current usage metrics show cumulative count of Article Views (full-text article views including HTML views, PDF and ePub downloads, according to the available data) and Abstracts Views on Vision4Press platform.
Data correspond to usage on the plateform after 2015. The current usage metrics is available 48-96 hours after online publication and is updated daily on week days.
Initial download of the metrics may take a while.