Fig. 5
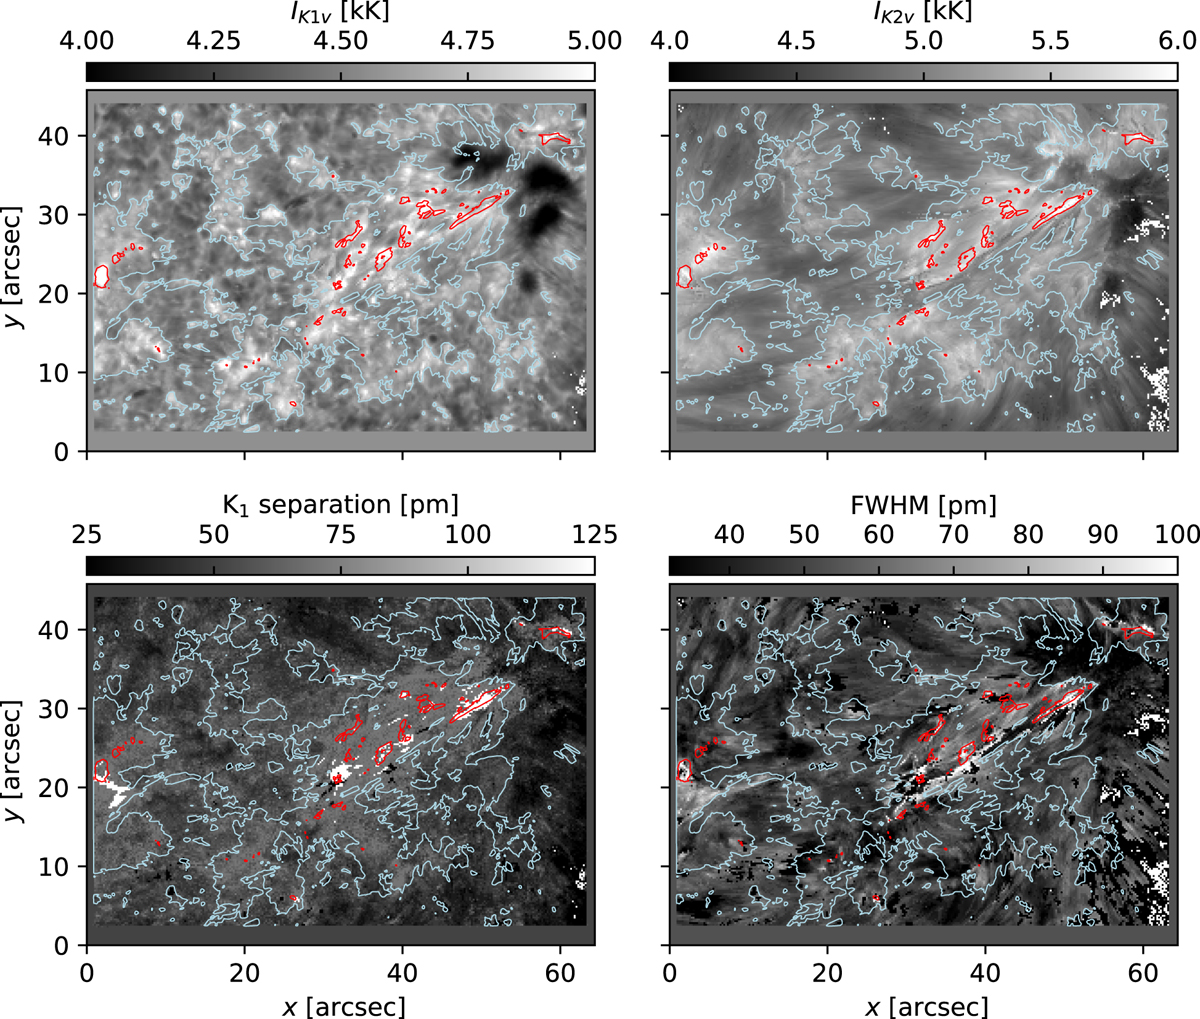
Properties of the Ca II K line profiles at 09:44:37 UT. Top row: intensities expressed as radiation temperatures in K1v and K2v . Bottom row: wavelength separation of the K1 minima and full width at half maximum of the central emission peak. The brightness range of all images has been clipped to enhance contrast. The light blue and red contours divide the image into low, intermediate and high brightness areas of the corresponding wavelength-summed Ca II K image.
Current usage metrics show cumulative count of Article Views (full-text article views including HTML views, PDF and ePub downloads, according to the available data) and Abstracts Views on Vision4Press platform.
Data correspond to usage on the plateform after 2015. The current usage metrics is available 48-96 hours after online publication and is updated daily on week days.
Initial download of the metrics may take a while.