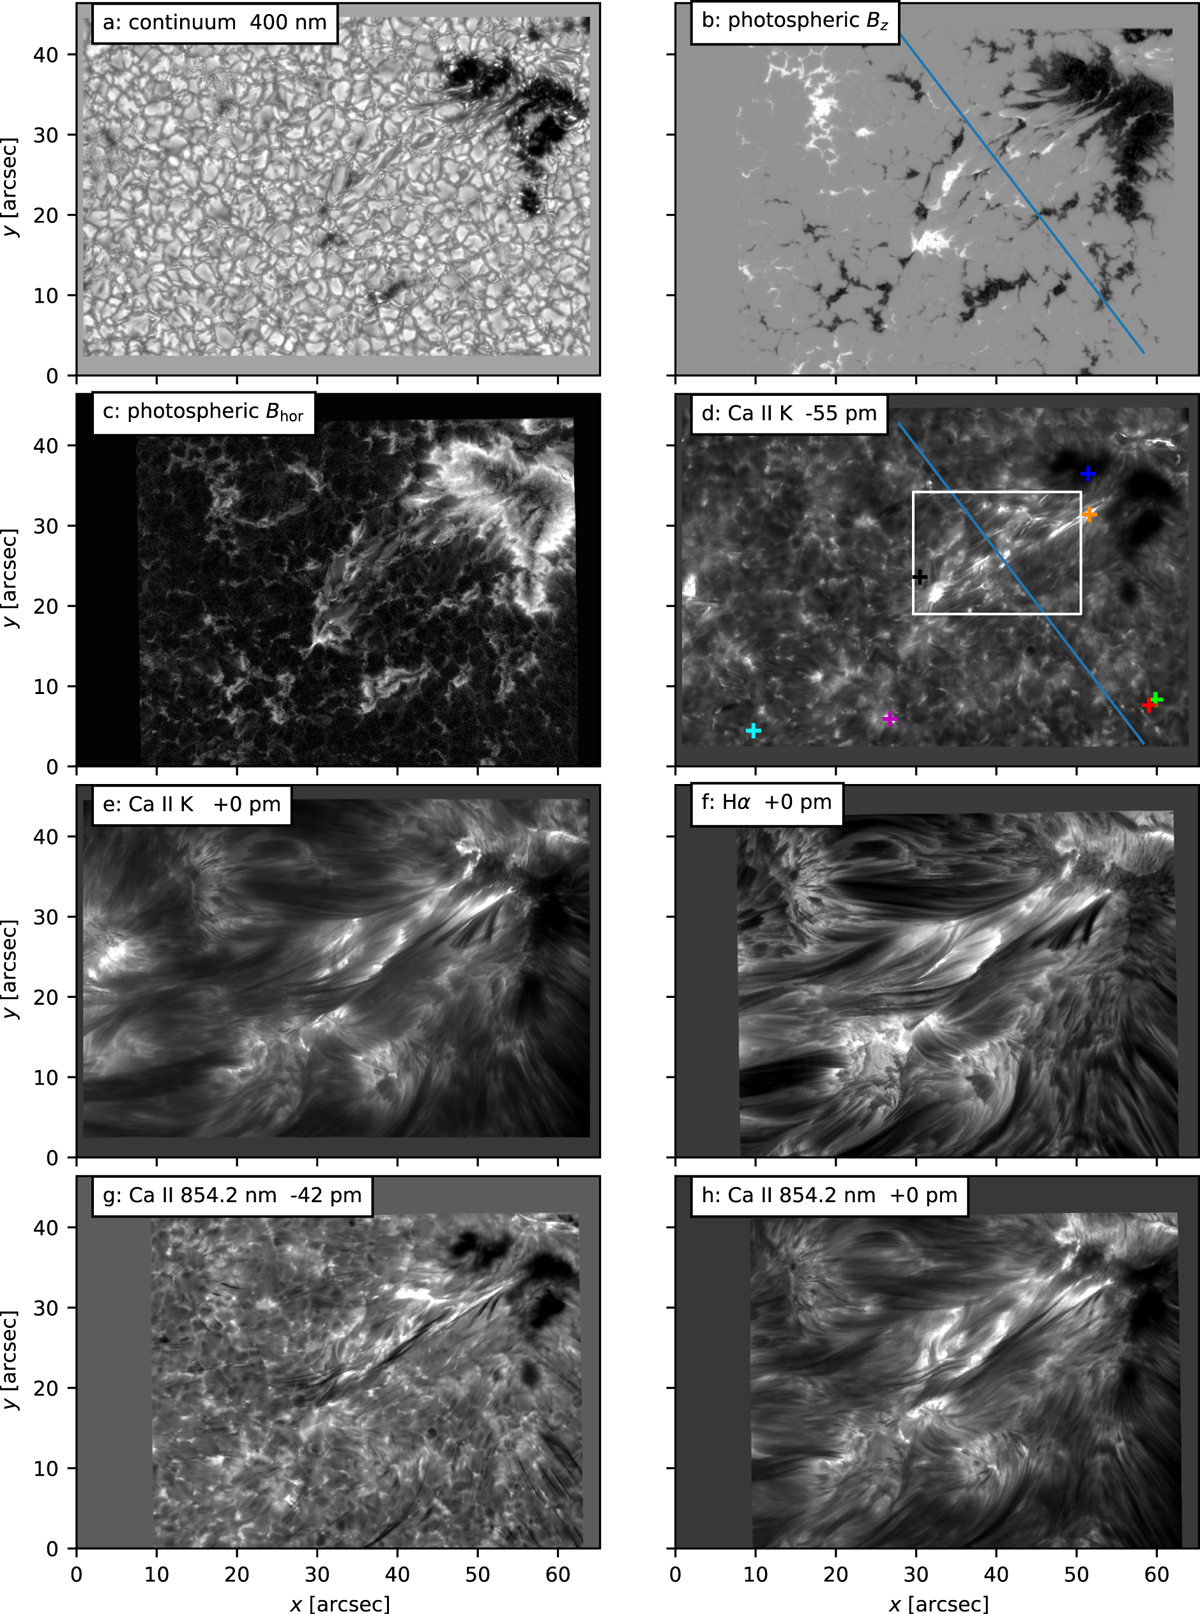
Fig. 1

Overview of observations taken at 09:44:37 UT. Panel a: continuum at 400 nm; panel b: Bz as inferred from a Milne–Eddington inversion of the Fe I 603.1 nm and 630.2 nm lines, the colour scale ranges from −2.0 kG to 1.4 kG; panel c: horizontal magnetic field from the same inversion, the colour scale ranges from 0 kG to 1.3 kG; panel d: Ca II K image in the K1v minimum of the average line profile; panel e: Ca II K at nominal line centre; panel f: Hα at nominal linecentre; panel g: blue wing of the Ca II 854.2 nm line; panel h: Ca II 854.2 nm at nominal line centre. The colour scales are clipped to exclude the 0.5% darkest and brightest pixels. The coloured plusses in panel d indicate the locations for which line profiles are shown in Figs. 2 and 3; the location of the xy subfield shown in Fig. 8 is indicated by a white box; the location of the timeslice shown in Fig. 9 with a blue line. An animated version of this figure showing the entire time sequence is available online.
Current usage metrics show cumulative count of Article Views (full-text article views including HTML views, PDF and ePub downloads, according to the available data) and Abstracts Views on Vision4Press platform.
Data correspond to usage on the plateform after 2015. The current usage metrics is available 48-96 hours after online publication and is updated daily on week days.
Initial download of the metrics may take a while.


