Fig. 6
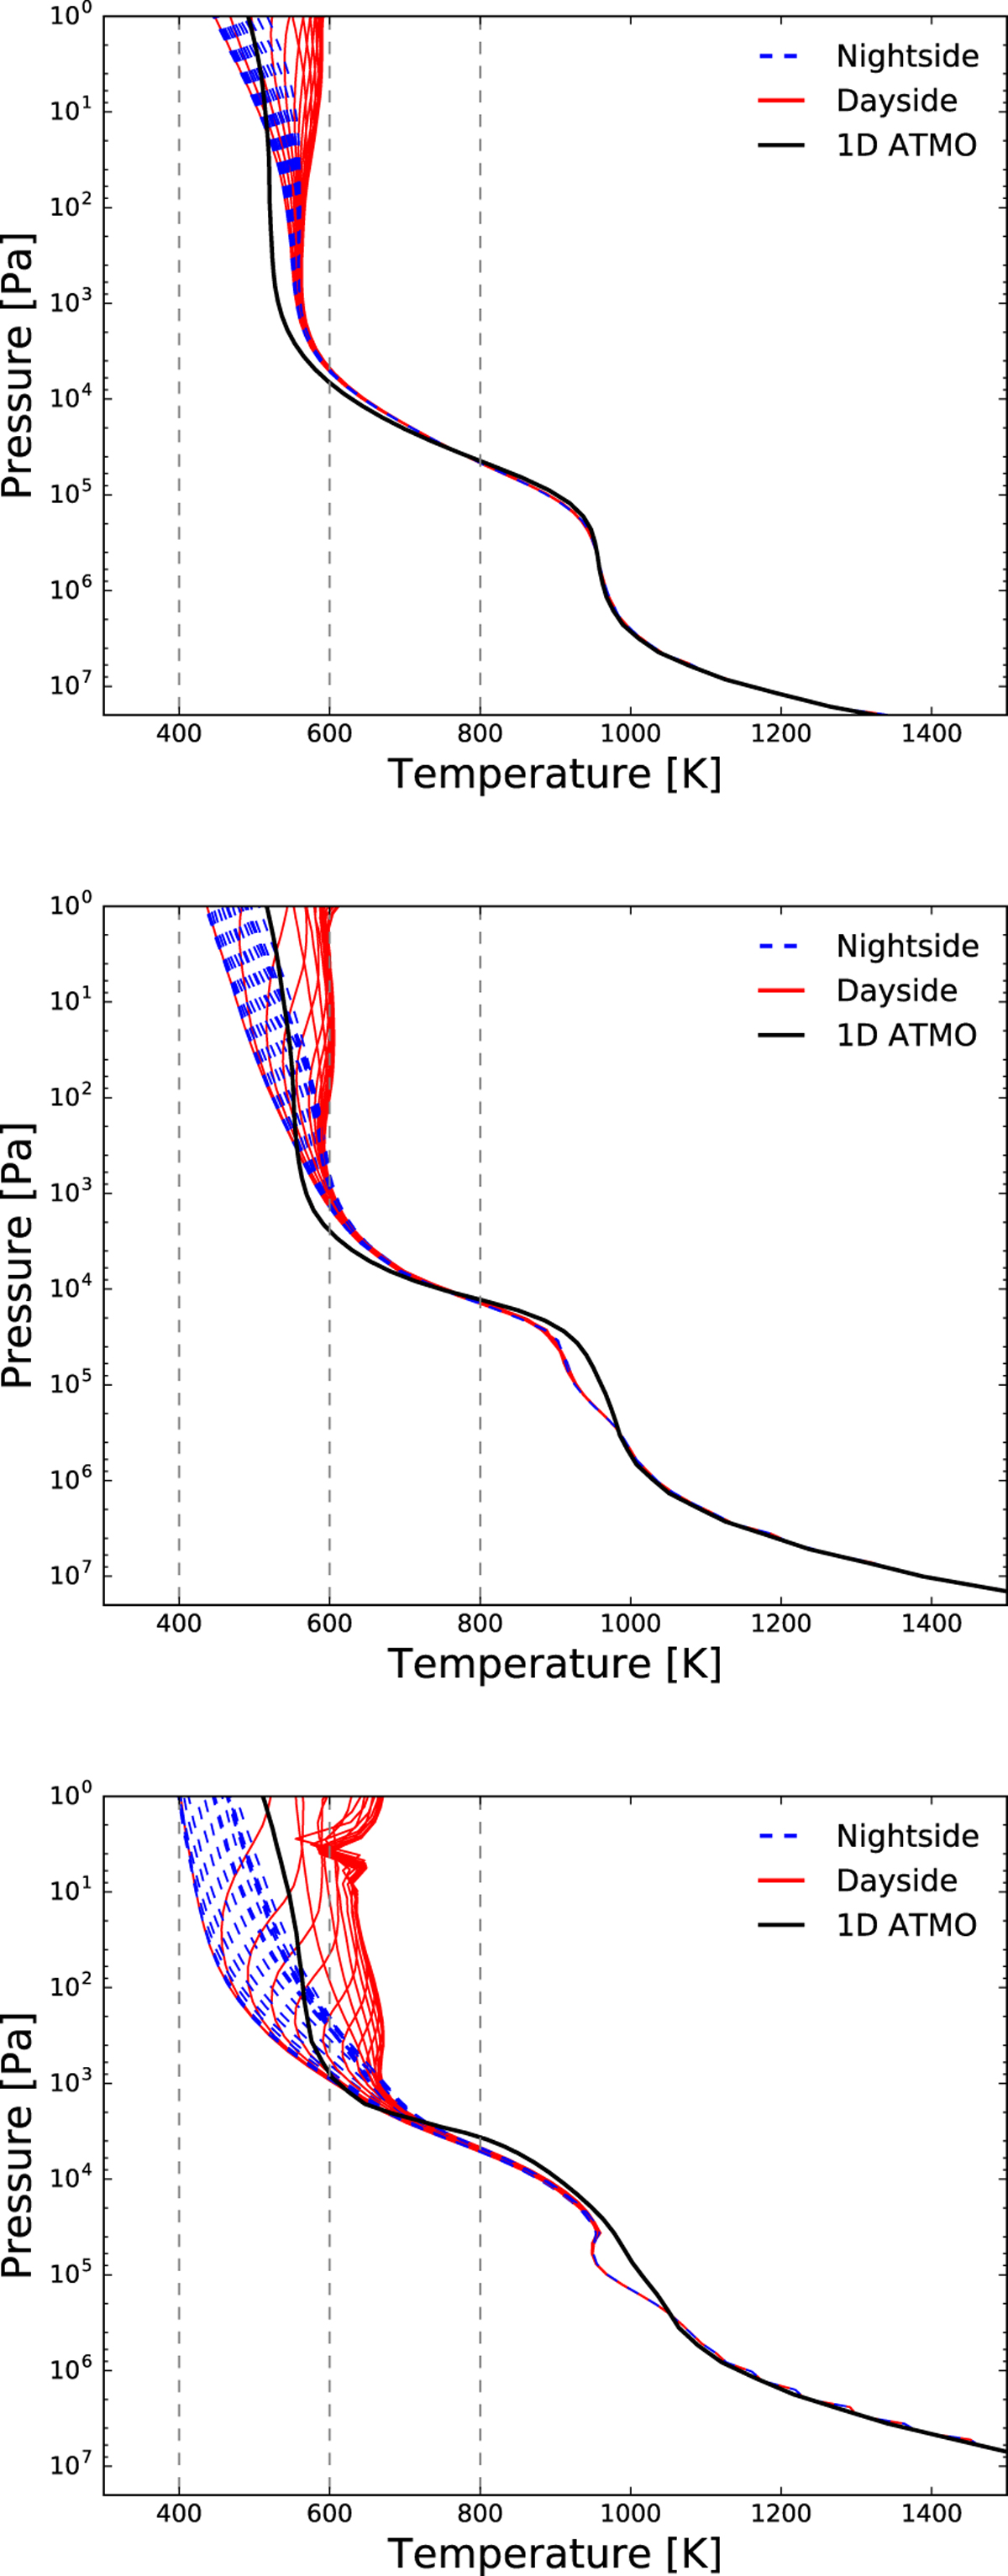
Pressure–temperature profiles extracted from the 3D grid at the equator (ϕ = 0°) for various longitudes, for the R1 (top), R10 (middle), R100 (bottom) simulations. Profiles taken from the dayside are shown in solid red lines while profiles from the nightside are shown in dashed blue lines. The black solid line is the 1D ATMO pressure–temperature profile used to initialise the 3D simulation.
Current usage metrics show cumulative count of Article Views (full-text article views including HTML views, PDF and ePub downloads, according to the available data) and Abstracts Views on Vision4Press platform.
Data correspond to usage on the plateform after 2015. The current usage metrics is available 48-96 hours after online publication and is updated daily on week days.
Initial download of the metrics may take a while.