Free Access
Fig. 12
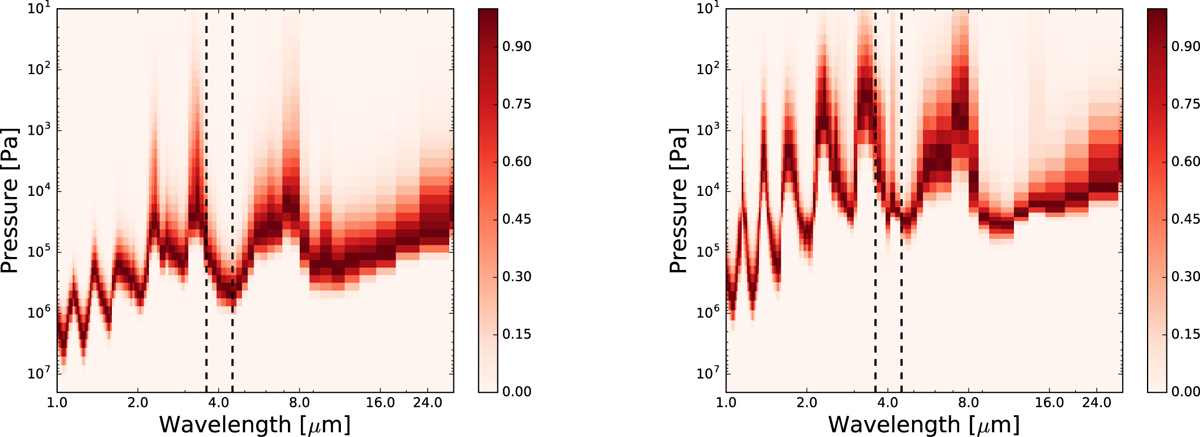
Spectral contribution functions as a function of pressure calculated from the 1D ATMO models assuming 1× (left) and 100× solar metallicity. Black dashed lines indicate 3.6 and 4.5 μm. The figures are plotted using the resolution (pressure and wavelength) of the model.
Current usage metrics show cumulative count of Article Views (full-text article views including HTML views, PDF and ePub downloads, according to the available data) and Abstracts Views on Vision4Press platform.
Data correspond to usage on the plateform after 2015. The current usage metrics is available 48-96 hours after online publication and is updated daily on week days.
Initial download of the metrics may take a while.