Fig. C.2
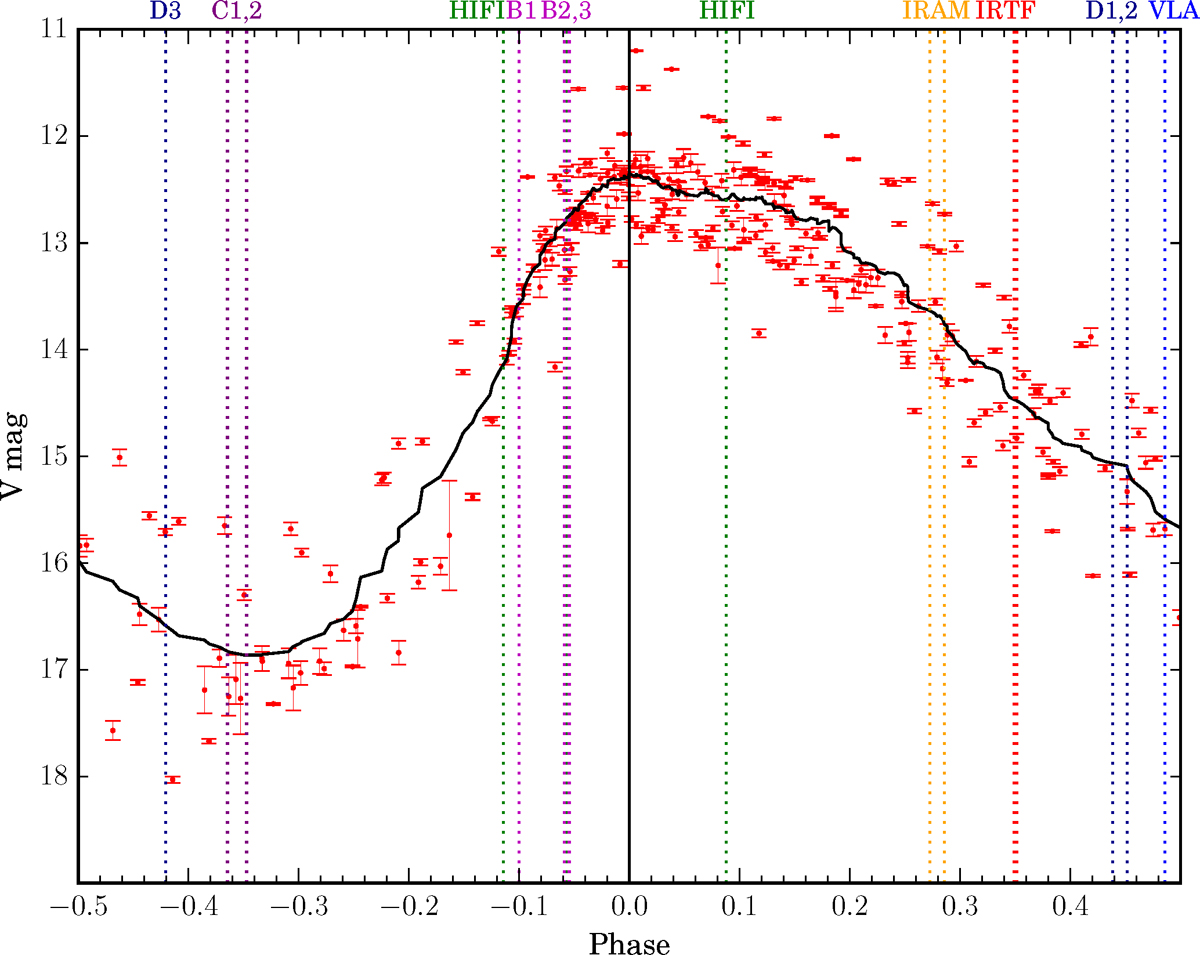
Phased V -band light curve of IK Tau in 2002–2016. Red points are the observations from the AAVSO International Database and the black curve is the smoothed light curve with a Savitzky-Golay filter. The phases of relevant NH3 observationsare labelled by vertical lines and on the top axis, with the same colour scheme as Fig. C.1. The label “VLA” represents the 2004 VLA observation. The numerals after “D”, “C”, and “B” are the ordinal numbers representingthe dates of VLA observations in 2015–2016 with the corresponding arrays (“B4” is discarded, see Tables A.1 and A.2).
Current usage metrics show cumulative count of Article Views (full-text article views including HTML views, PDF and ePub downloads, according to the available data) and Abstracts Views on Vision4Press platform.
Data correspond to usage on the plateform after 2015. The current usage metrics is available 48-96 hours after online publication and is updated daily on week days.
Initial download of the metrics may take a while.