Fig. 2
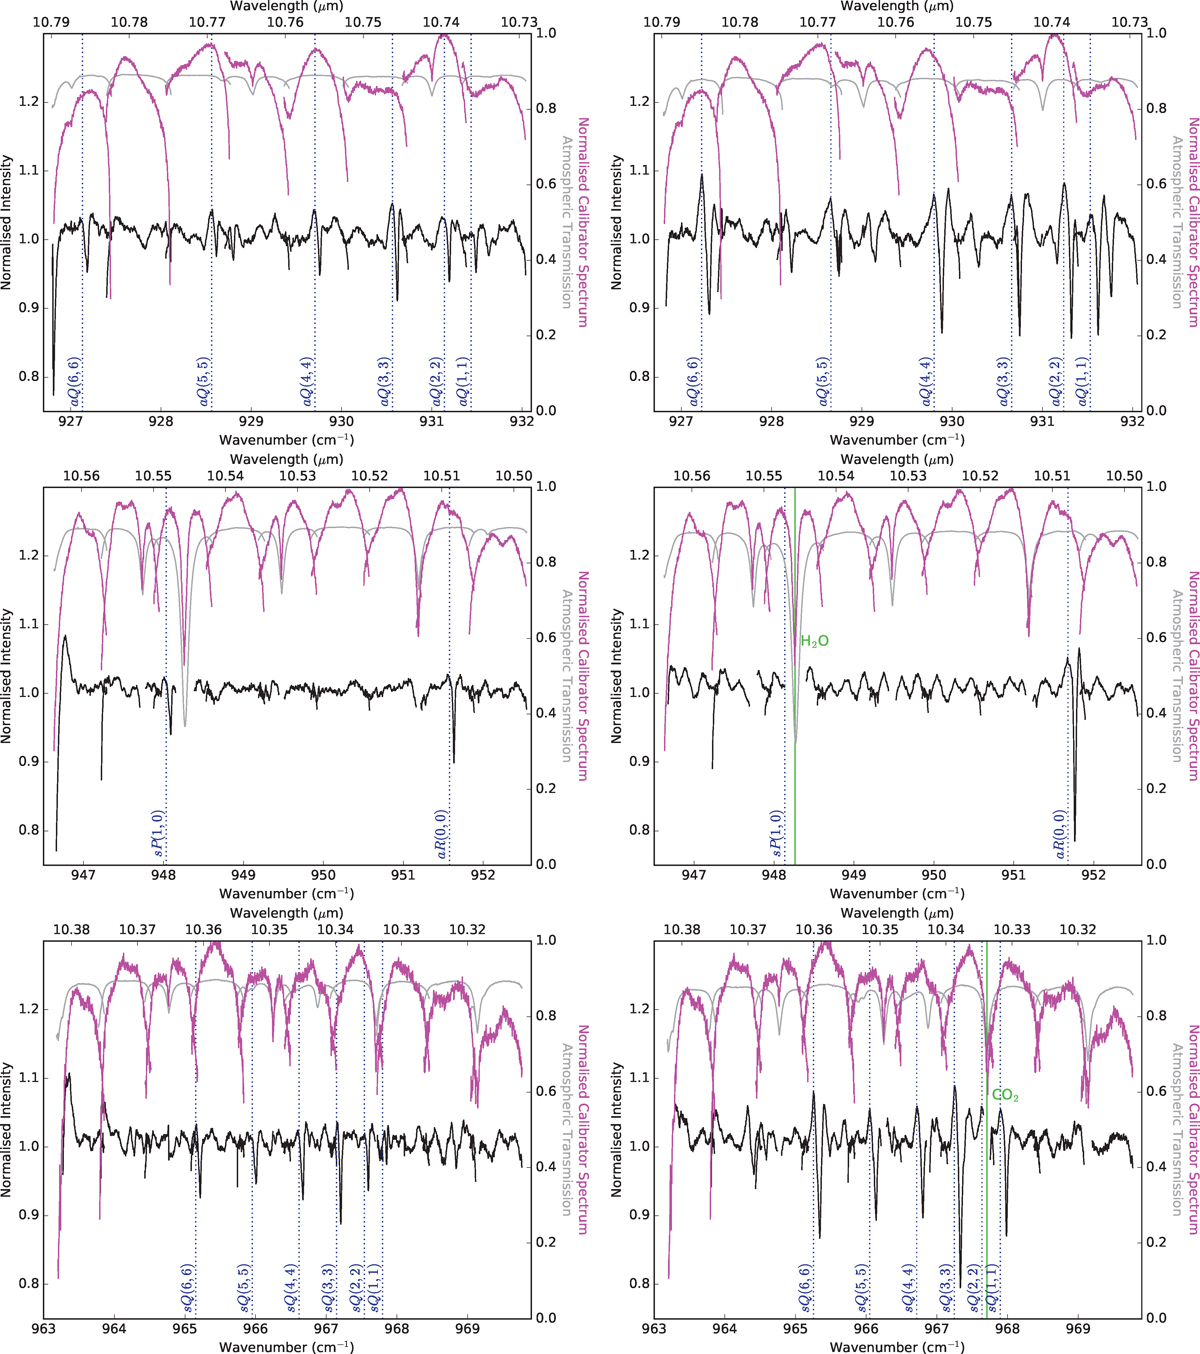
NASA IRTF/TEXES spectra (in black) of IK Tau (left) and VY CMa (right) near the wavelengths (wavenumbers) of 10.7 μm (930 cm −1 ; top), 10.5 μm (950 cm −1 ; middle), and10.3 μm (966 cm −1 ; bottom). The wavenumber axes are in the topocentric frame of reference. The target spectra are normalised and zoomed. The normalised calibrator spectra are plotted in magenta and the fractional atmospheric transmissions are shown in grey. Only the target data with atmospheric transmission greater than 0.8 are plotted. The dark blue dotted lines in each spectrum indicate the positions of the labelled NH3 rovibrational transitions in the stellar rest frame and the green solid lines indicatethe telluric lines (in the observatory frame) that blend with the NH3 lines of VY CMa. We assume the systemic velocities of IK Tau and VY CMa to be 34 km s −1 and 22 km s−1, respectively.
Current usage metrics show cumulative count of Article Views (full-text article views including HTML views, PDF and ePub downloads, according to the available data) and Abstracts Views on Vision4Press platform.
Data correspond to usage on the plateform after 2015. The current usage metrics is available 48-96 hours after online publication and is updated daily on week days.
Initial download of the metrics may take a while.