Fig. 14
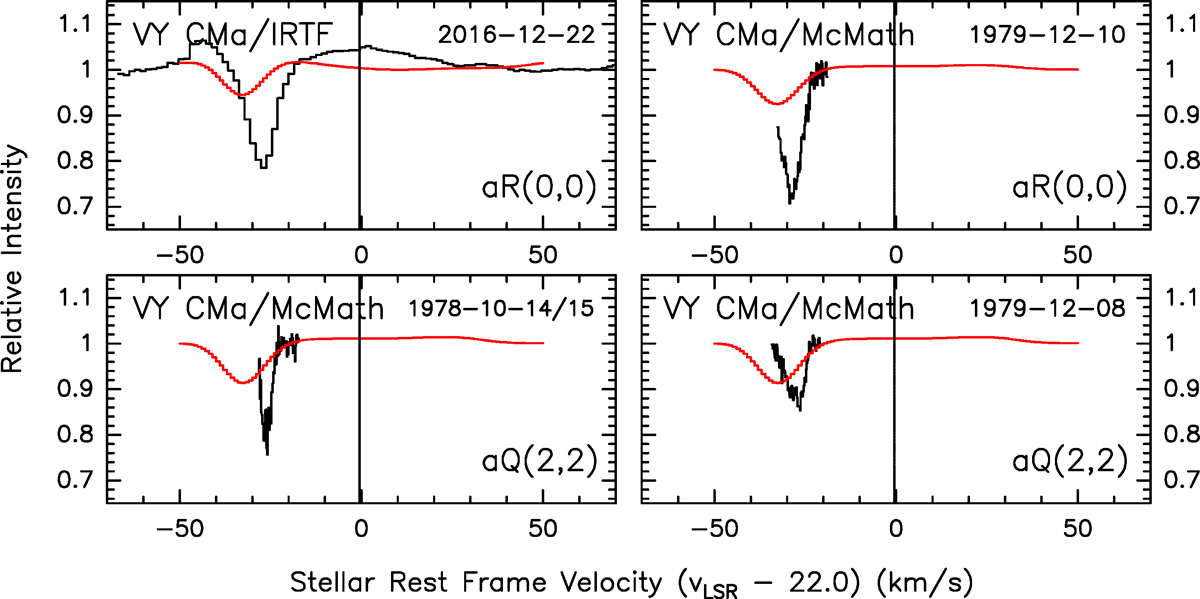
NH3 rovibrational spectra of VY CMa in the transitions aR(0, 0) (top) and aQ(2, 2) (bottom). The black line in the top-left panel shows the observed spectrum from the NASA IRTF while those in other panels show the old spectra from the McMath Solar Telescope, as reproduced from Fig. 1 of McLaren & Betz (1980, © AAS. Reproduced with permission). Red lines show the modelled spectra in all panels. The modelled spectrum in the top-left panel was divided by a smoothed version of itself as in the real data (see Sect. 3.4) in order to induce the similar distortion in the line wings.
Current usage metrics show cumulative count of Article Views (full-text article views including HTML views, PDF and ePub downloads, according to the available data) and Abstracts Views on Vision4Press platform.
Data correspond to usage on the plateform after 2015. The current usage metrics is available 48-96 hours after online publication and is updated daily on week days.
Initial download of the metrics may take a while.