Fig. 1
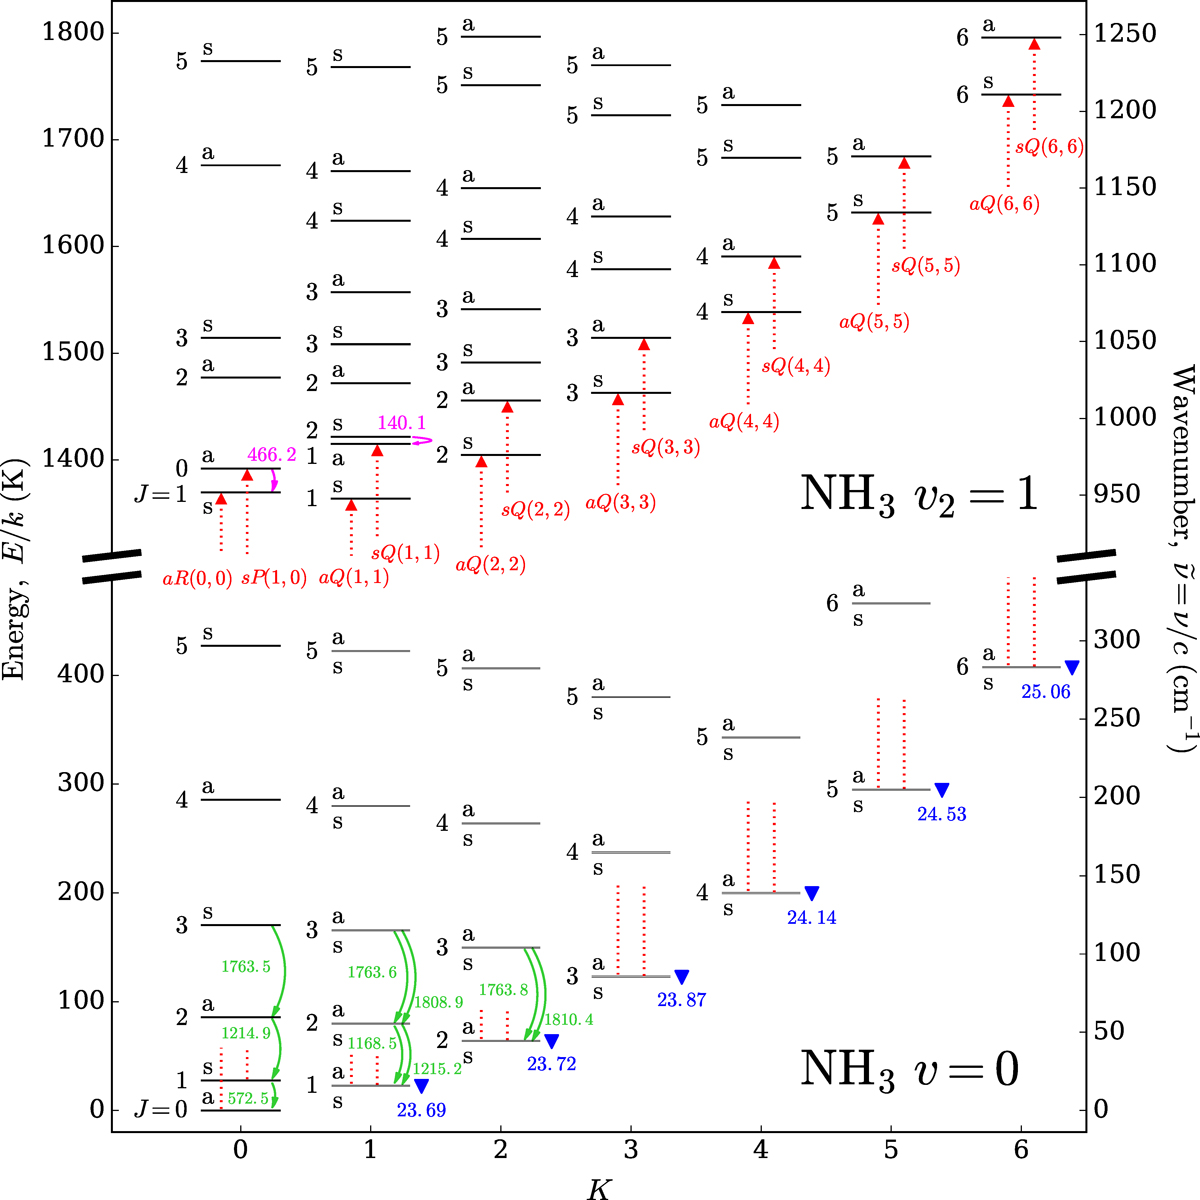
Energy level diagram of NH3
showing the ground (v = 0;
lower half) and the first excited vibrational (v2 = 1;
upper half) states. The truncated vertical axes on the left and right show the energy from the ground
(E∕k;
K) and the corresponding wavenumber (![]() ;
cm −1 ),
respectively;the horizontal axis shows the quantum number K.
The integral value next to each level or inversion doublet shows the quantum number
J;
the letter “a” or “s” represents the symmetry of the level. Ground-state inversion doublets
(K > 0)
can only be resolved when the figure is zoomed in due to the small energy differences. Important transitions as
discussed in this article are labelled: curved green and magenta arrows indicate the (sub)millimetre rotational
line emission within the ground and excited states, respectively; blue triangles mark the radio metastable
inversion line emission in the ground state; and upward red dotted arrows indicate the absorption in the MIR
ν2
band. These transitions are labelled by their rest frequencies in GHz (see Table 1), except the MIR
transitions which are labelled by their transition names (see Table 2).
;
cm −1 ),
respectively;the horizontal axis shows the quantum number K.
The integral value next to each level or inversion doublet shows the quantum number
J;
the letter “a” or “s” represents the symmetry of the level. Ground-state inversion doublets
(K > 0)
can only be resolved when the figure is zoomed in due to the small energy differences. Important transitions as
discussed in this article are labelled: curved green and magenta arrows indicate the (sub)millimetre rotational
line emission within the ground and excited states, respectively; blue triangles mark the radio metastable
inversion line emission in the ground state; and upward red dotted arrows indicate the absorption in the MIR
ν2
band. These transitions are labelled by their rest frequencies in GHz (see Table 1), except the MIR
transitions which are labelled by their transition names (see Table 2).
Current usage metrics show cumulative count of Article Views (full-text article views including HTML views, PDF and ePub downloads, according to the available data) and Abstracts Views on Vision4Press platform.
Data correspond to usage on the plateform after 2015. The current usage metrics is available 48-96 hours after online publication and is updated daily on week days.
Initial download of the metrics may take a while.