Fig. 9
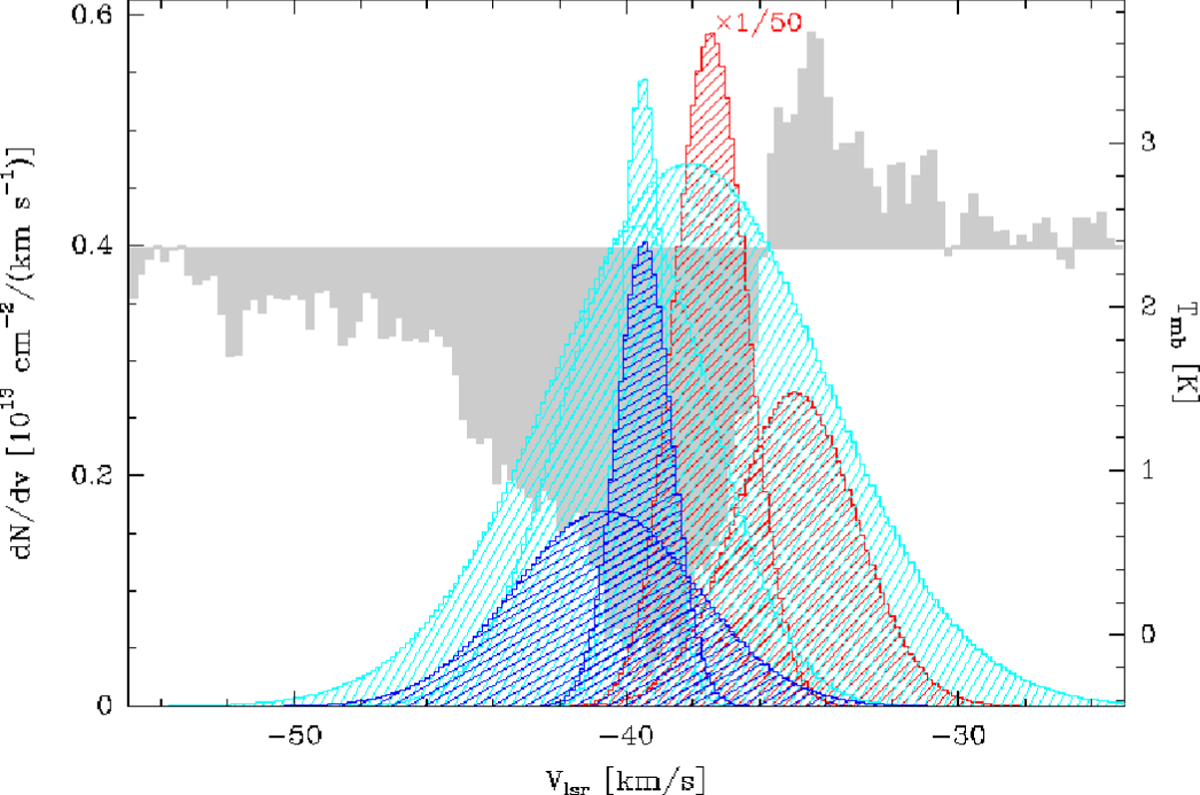
Breakup of CH components observed around W3 IRS5. Red: d N∕d υ for the two hot core components (scaled down by a factor of 50). Cyan: same for the three common-envelope components. Blue: cold foreground components. The gray histogram shows the P Cygni profile of the HF ground-state transition (J = 1 → 0, archival HIFI data, PRISMAS key science project). For details see text and Table 3.
Current usage metrics show cumulative count of Article Views (full-text article views including HTML views, PDF and ePub downloads, according to the available data) and Abstracts Views on Vision4Press platform.
Data correspond to usage on the plateform after 2015. The current usage metrics is available 48-96 hours after online publication and is updated daily on week days.
Initial download of the metrics may take a while.