Fig. 8
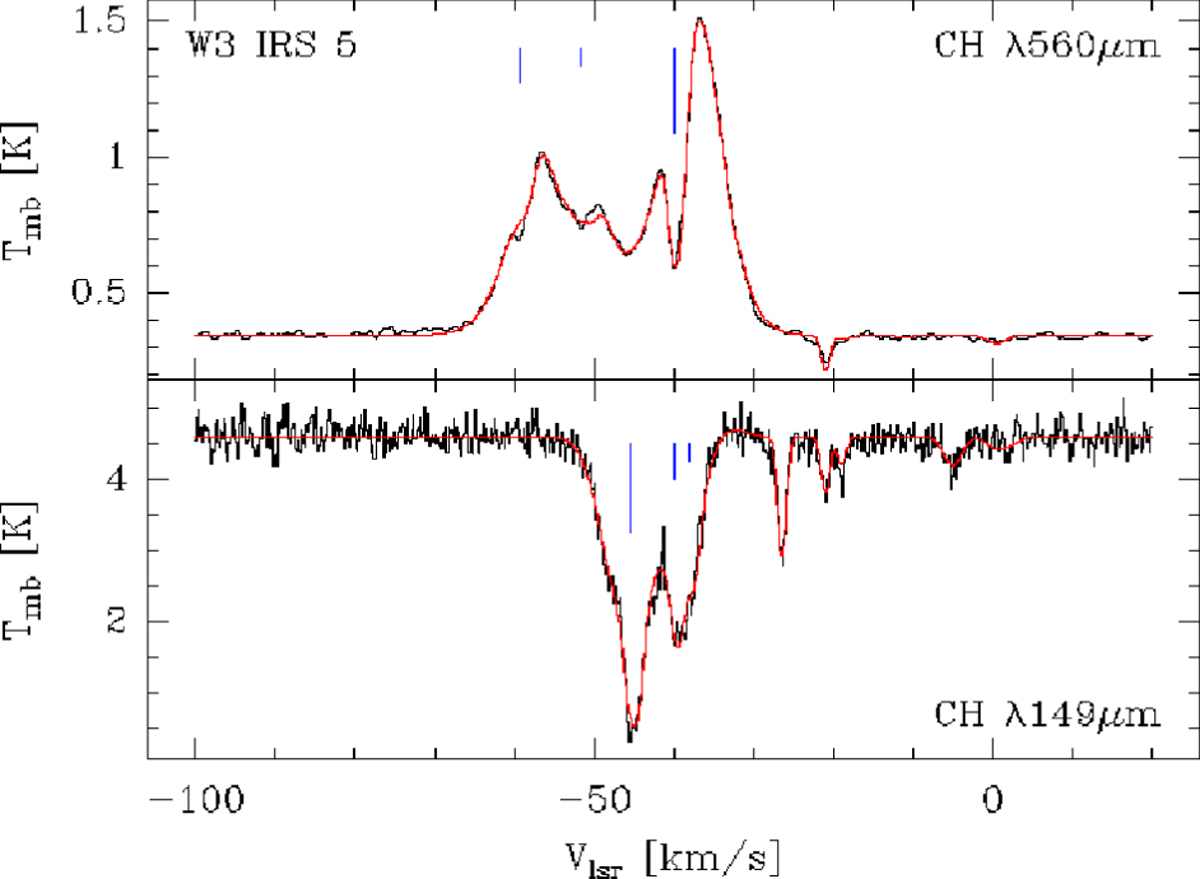
CH emission and absorption towards W3 IRS5. Top panel: λ560 μm line (HIFI/PRISMAS). Bottom panel: λ149 μm (upGREAT). The red lines indicate the commonfit to both spectra (in the χ2 sense). The hyperfine splitting is indicated by blue markers, scaling with the corresponding weight for a complete ground-state level population. The strongest hyperfine component of the λ560 μm line is centered close to the systemic velocity. For details see text.
Current usage metrics show cumulative count of Article Views (full-text article views including HTML views, PDF and ePub downloads, according to the available data) and Abstracts Views on Vision4Press platform.
Data correspond to usage on the plateform after 2015. The current usage metrics is available 48-96 hours after online publication and is updated daily on week days.
Initial download of the metrics may take a while.