Free Access
Fig. 6
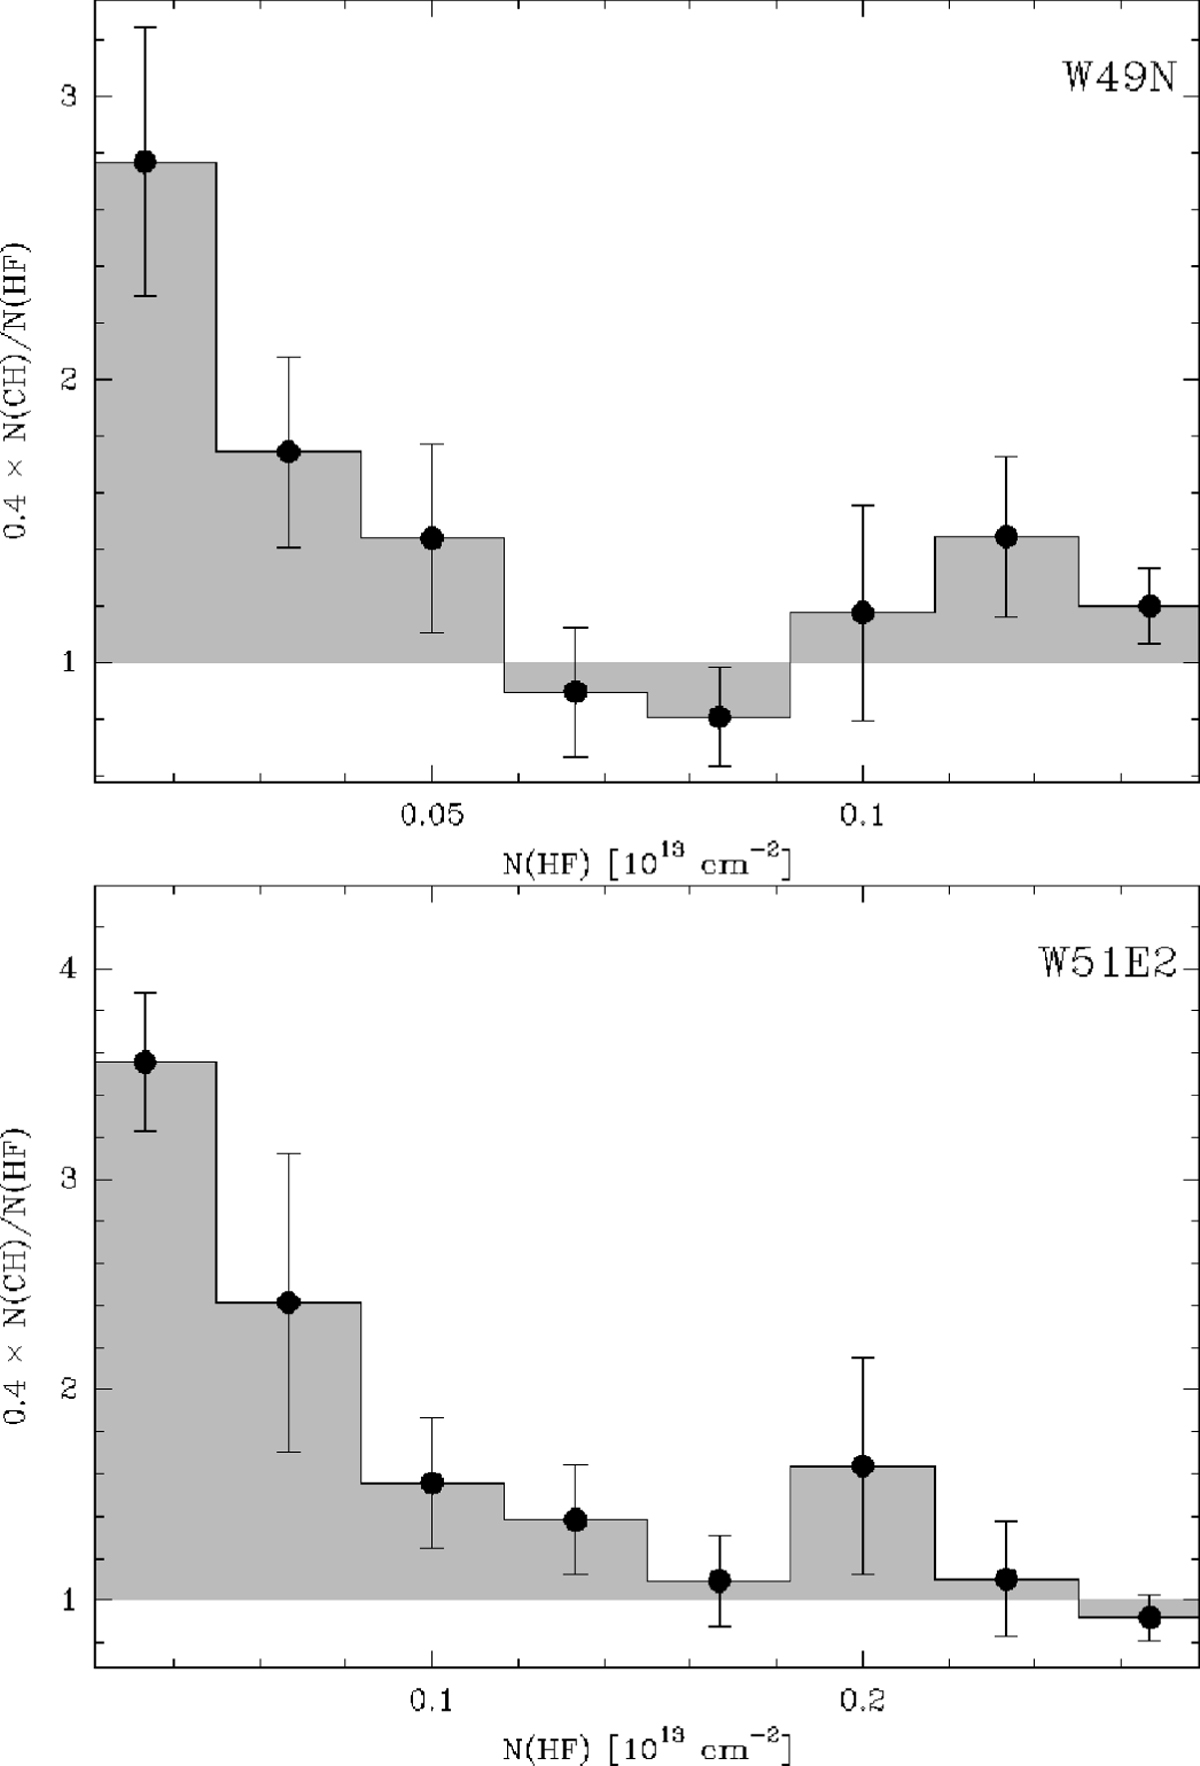
Over-abundance of CH, defined as 0.4N(CH)∕N(HF) vs. N(HF). Column densities are derived from 1 km s −1 -wide velocity intervals in the spectral distribution of Nv (cf. Fig. 2). Only column densities with at least a 3σ detection are used. Error-bars are deduced from the variances of the abundances within each histogram bin.
Current usage metrics show cumulative count of Article Views (full-text article views including HTML views, PDF and ePub downloads, according to the available data) and Abstracts Views on Vision4Press platform.
Data correspond to usage on the plateform after 2015. The current usage metrics is available 48-96 hours after online publication and is updated daily on week days.
Initial download of the metrics may take a while.