Free Access
Fig. 5
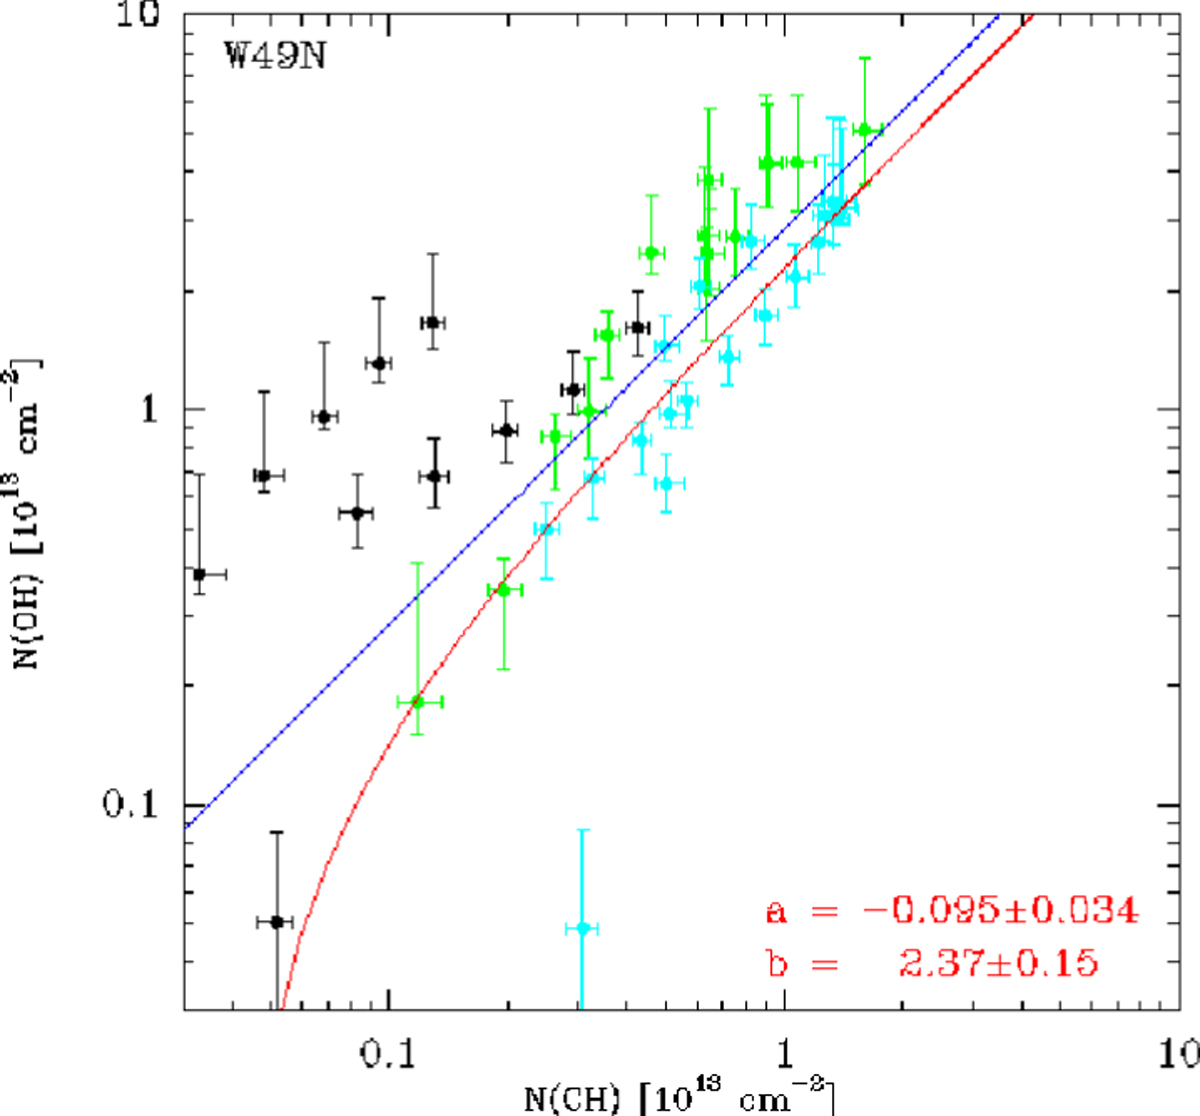
Correlation between OH and CH column densities towards W49 N. The blue line is for a N(OH )∕N(H2) of 10−7 . The red line shows the weighted linear regression, the resulting OH/CH abundance ratio is given in the lower-right corner. Velocity bins for the column densities and color-codes are as in Fig. 3.
Current usage metrics show cumulative count of Article Views (full-text article views including HTML views, PDF and ePub downloads, according to the available data) and Abstracts Views on Vision4Press platform.
Data correspond to usage on the plateform after 2015. The current usage metrics is available 48-96 hours after online publication and is updated daily on week days.
Initial download of the metrics may take a while.