Fig. 3
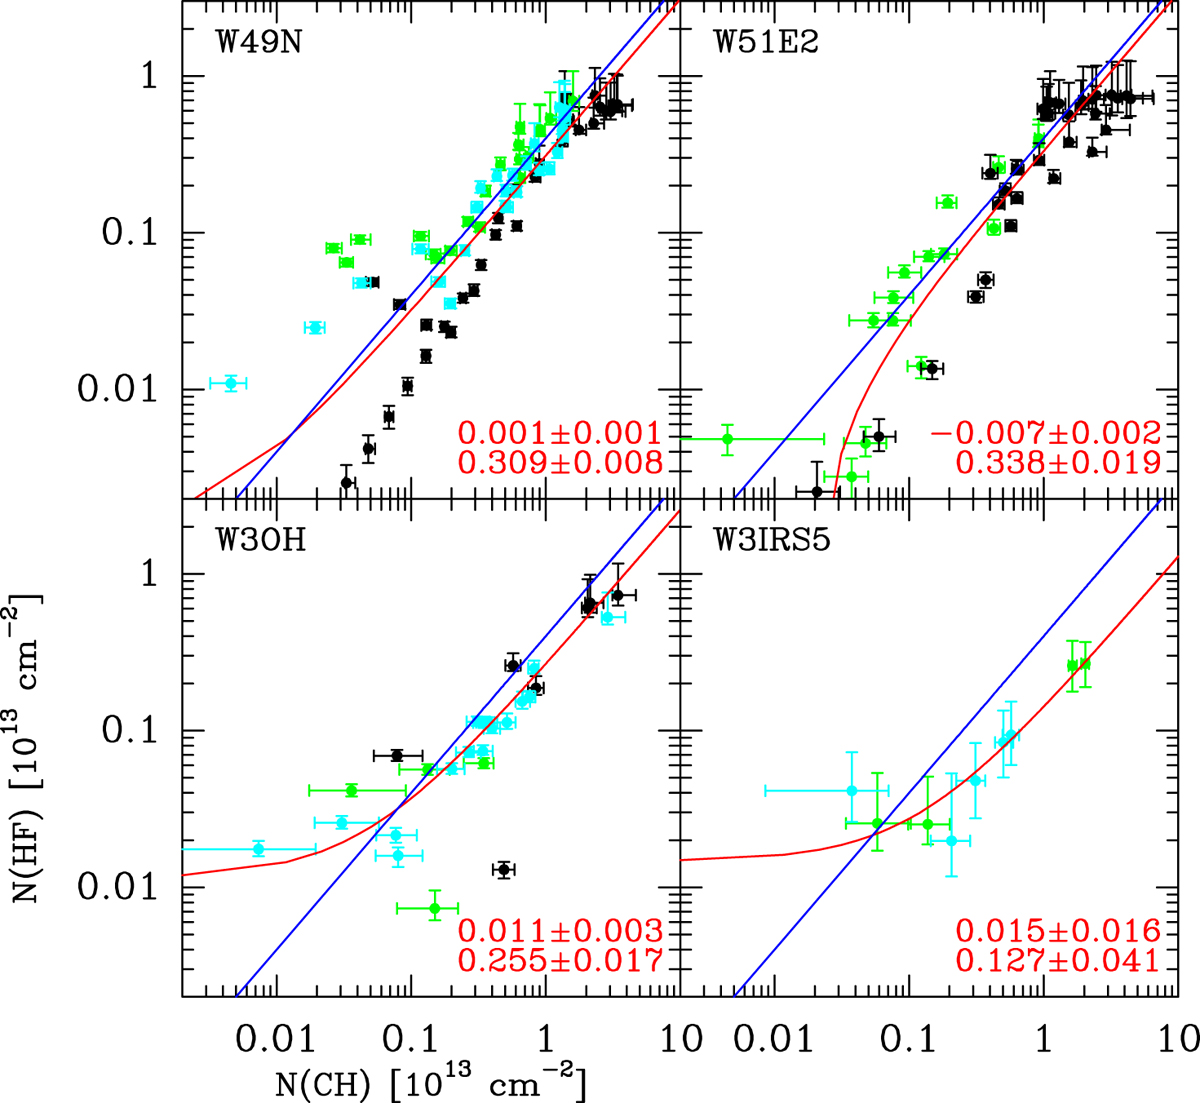
Correlation between HF and CH column densities towards W49 N, W51 e2, W3 IRS5 and W3(OH) (clockwise from top left). Column densities are for 1 km s −1 wide velocity intervals (Fig. 2). Ordinate offsets and slopes from the weighted regression (parameters a and b in Eq. (2)) are given in the lower-right corners. The red lines show the corresponding fits, the blue lines a ratio of HF/CH = 0.4 (Shefferet al. 2008; Sonnentrucker et al. 2015). Double-logarithmic scales illustrate the bimodal distribution at low column densities towards W49 N and W51 e2. Black markers indicate the absorption around, or close to, the location of the continuum source (W49 N: υlsr < 27km s−1 ; W51 e2: υlsr > 30km s−1 ; W3(OH), W3 IRS5: υlsr < −30km s−1 ). Green markers indicate: for W49 N, 27 km s-1 < υlsr < 47 km s-1, for W51 e2, υlsr < 30km s−1 , and for W3(OH), W3 IRS5 − 30 km s-1 < υlsr < −15 km s-1. Remaining velocities are shown in cyan.
Current usage metrics show cumulative count of Article Views (full-text article views including HTML views, PDF and ePub downloads, according to the available data) and Abstracts Views on Vision4Press platform.
Data correspond to usage on the plateform after 2015. The current usage metrics is available 48-96 hours after online publication and is updated daily on week days.
Initial download of the metrics may take a while.