Fig. 2
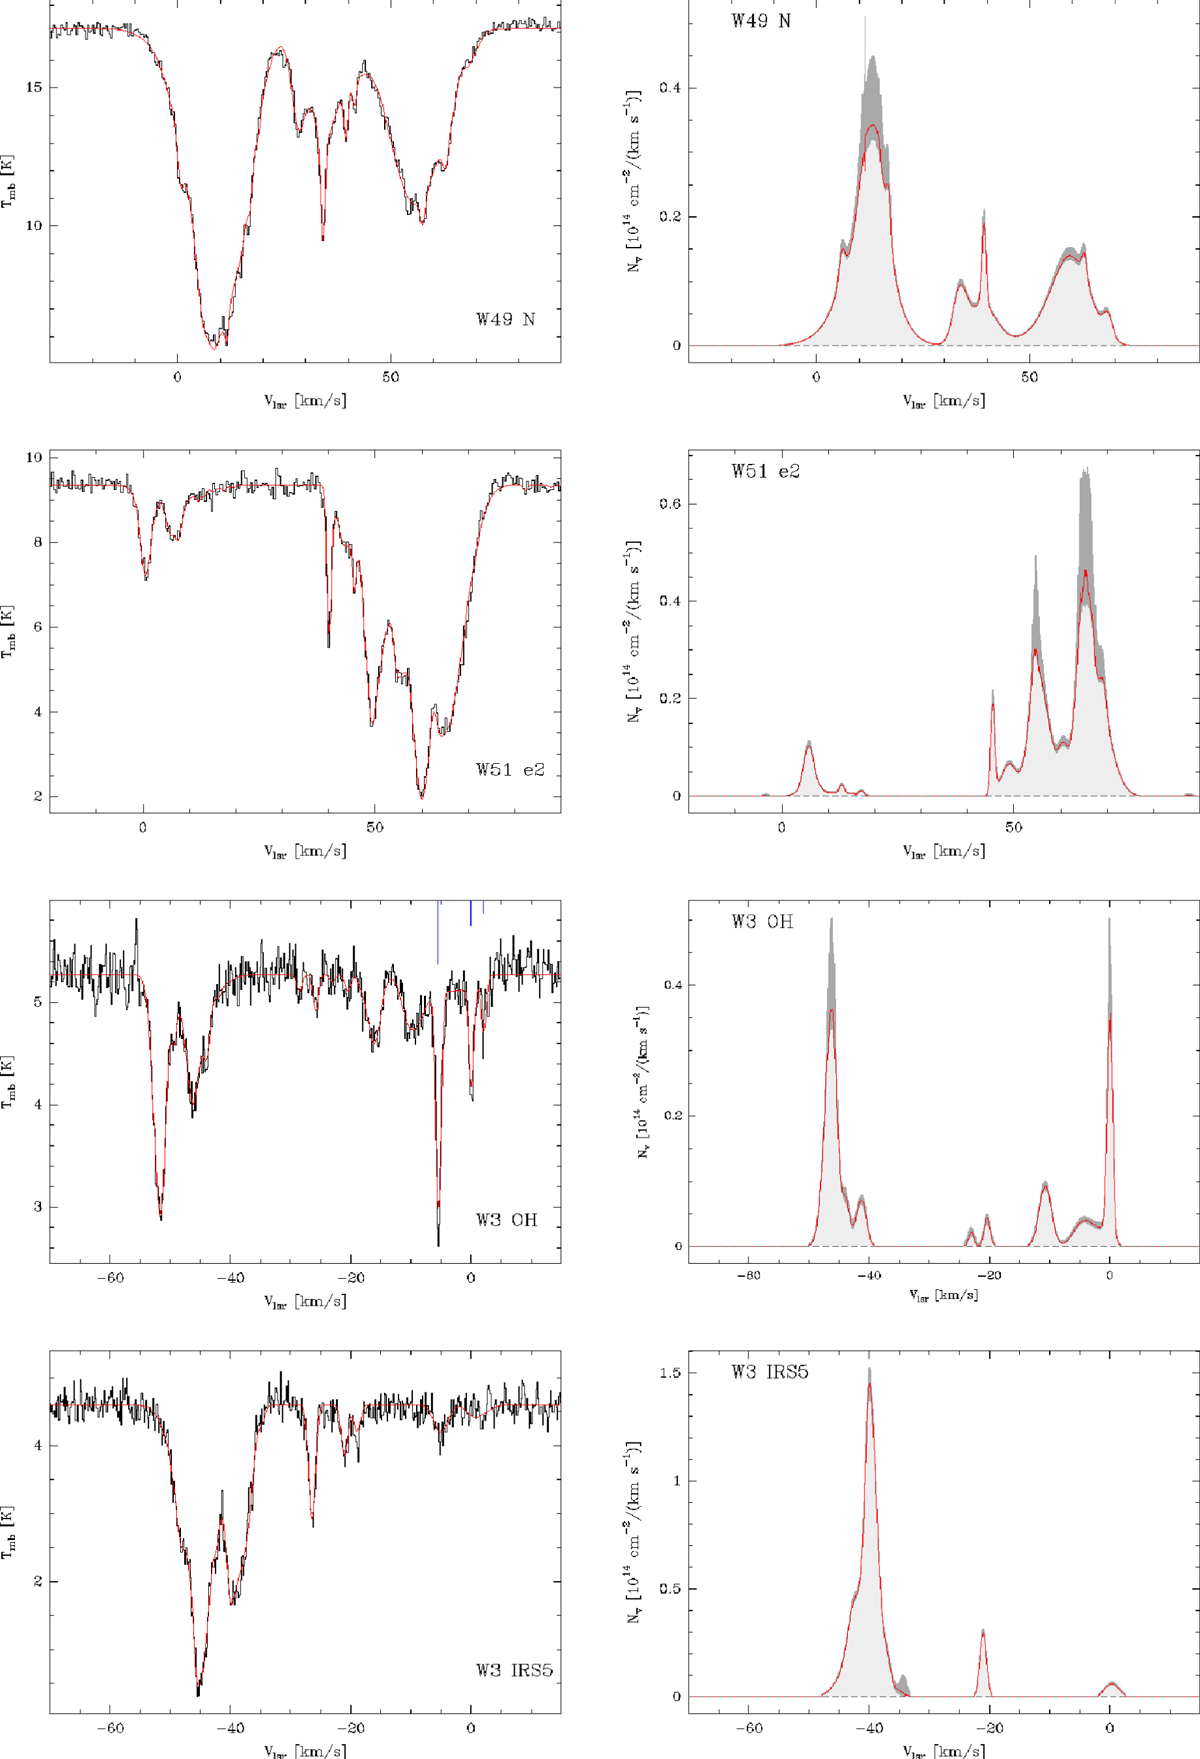
CH λ149 μm spectra (left panel, the reference frequency for the velocity scale givenby the second HFC) and deduced column density profiles (right panel) for (from top to bottom): W49 N, W51 e2, W3(OH), W3 IRS5. The blue markers in the W3(OH) spectrum show the hyperfine splitting and weights). The median column densities are indicated by the red lines. The dark-gray-shadowed profiles indicate the (−σ− , +σ+) limits, that is, 84.13% confidence, assuming a 5% error in the continuum level.
Current usage metrics show cumulative count of Article Views (full-text article views including HTML views, PDF and ePub downloads, according to the available data) and Abstracts Views on Vision4Press platform.
Data correspond to usage on the plateform after 2015. The current usage metrics is available 48-96 hours after online publication and is updated daily on week days.
Initial download of the metrics may take a while.