Fig. C.1
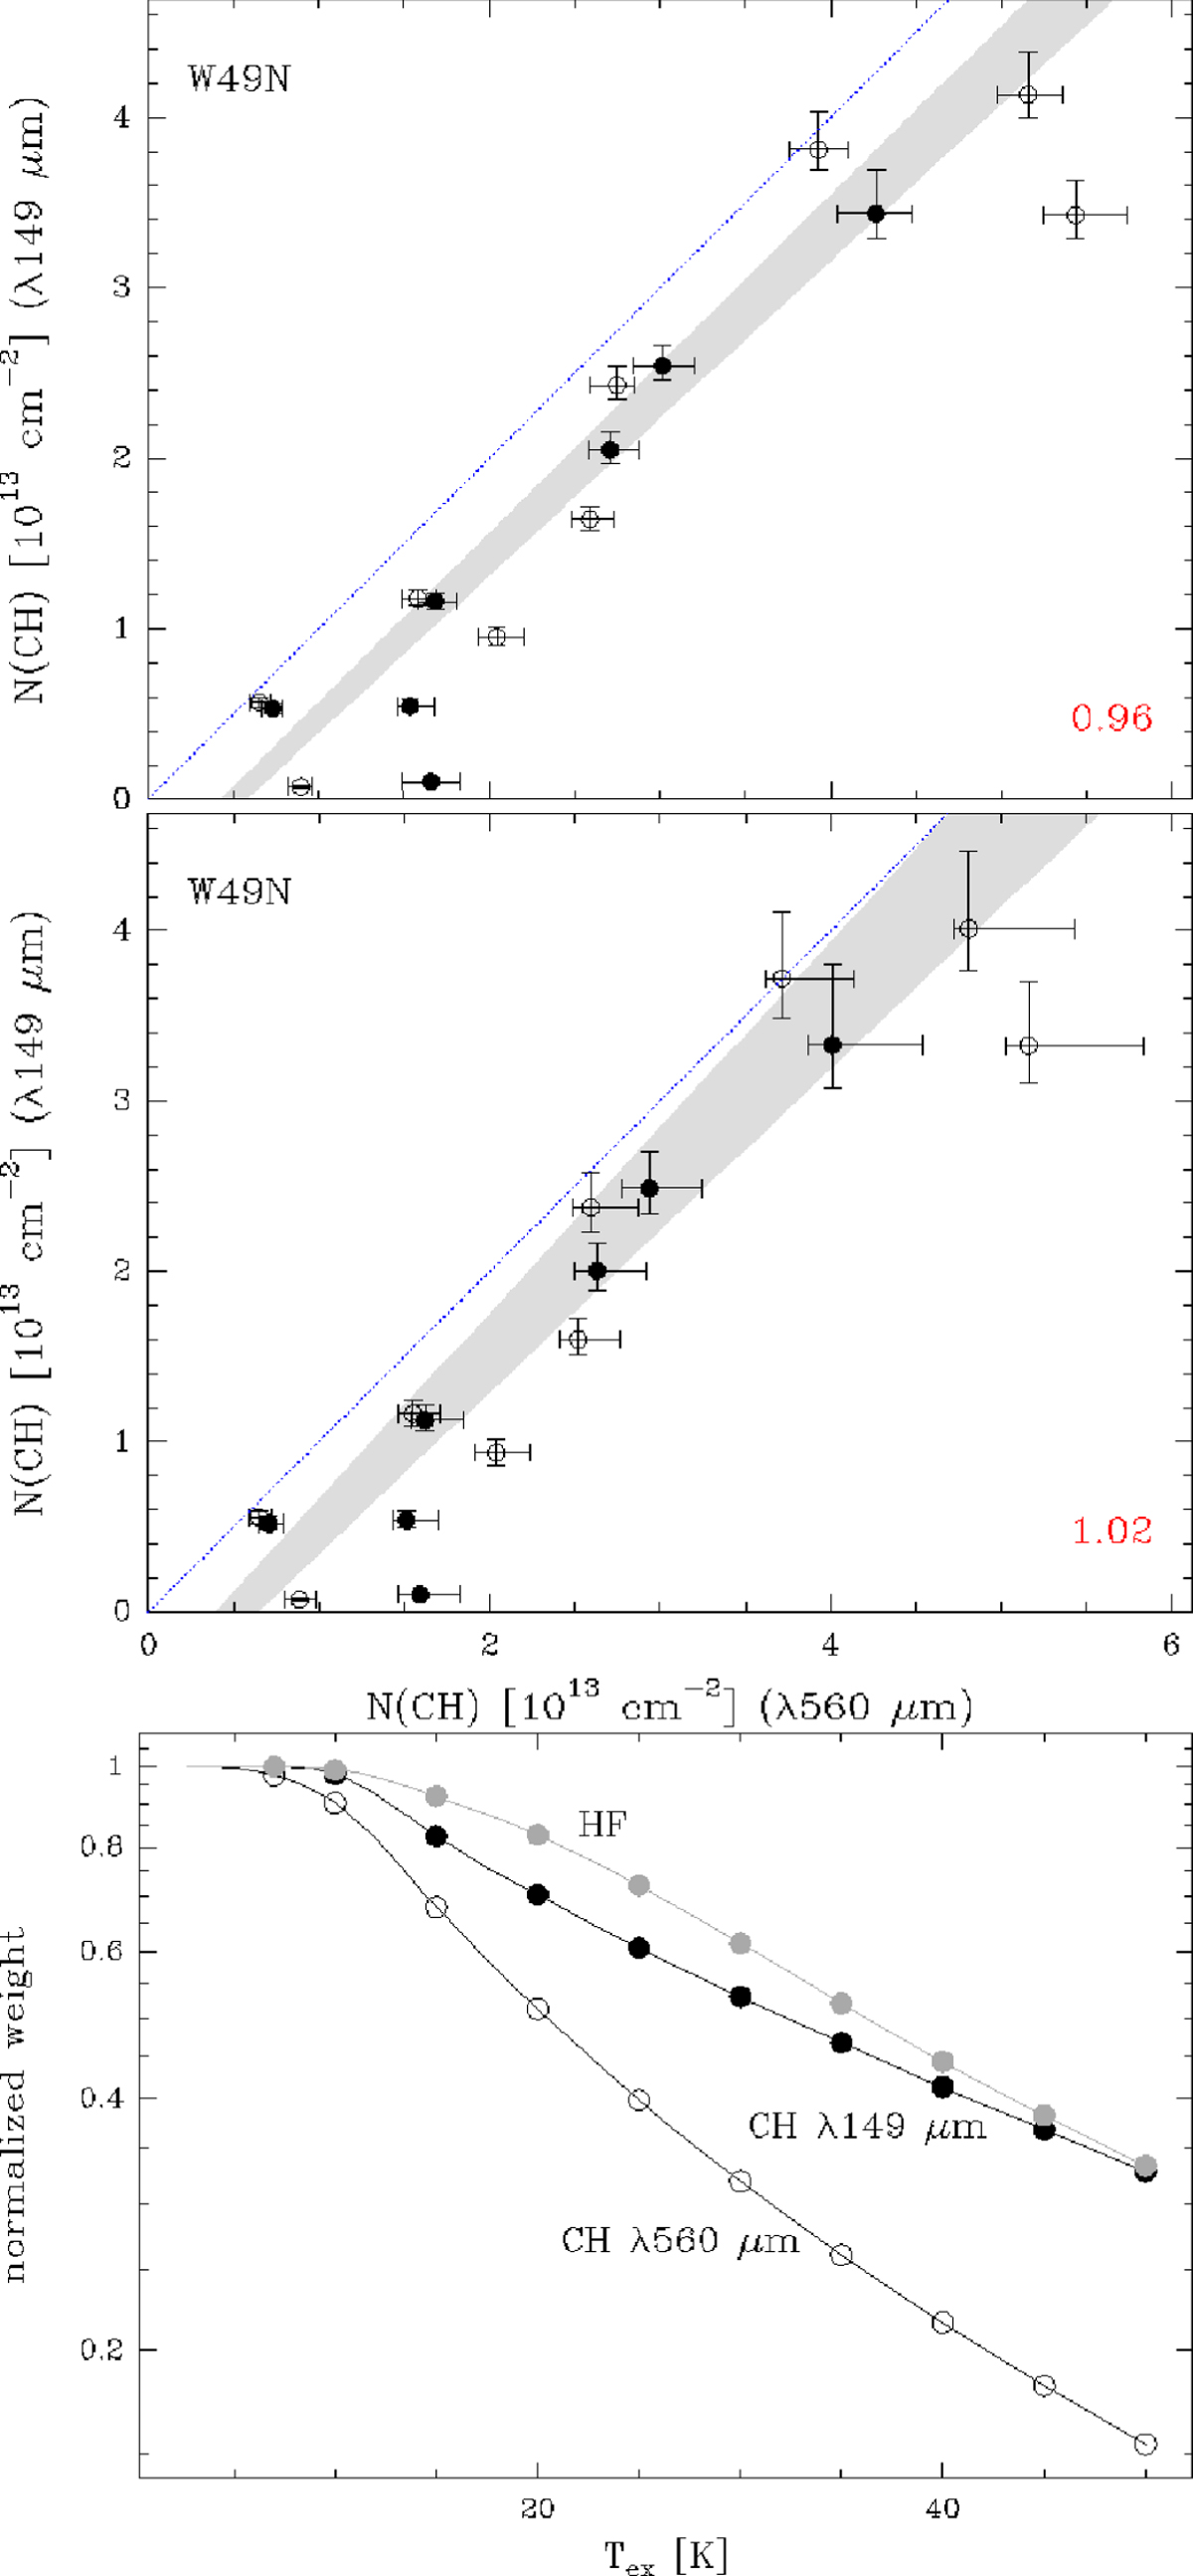
Comparison of column densities derived from the λ149 μm and λ560 μm lines, assuming a 5% error in the continuum level (top panel) and a 10% error (center panel). The gray-shaded area covers all data points within the 1σ limits of the weighted linear regression (derived slopes in the bottom right corners). The column densities refer to 3 km s−1 wide velocity intervals in the spectral distribution of Nv (cf. Fig. 2). Only velocities above 30 km s−1 were considered. The dotted blue line indicates the bisector for identical column densities derived from both lines. Bottom panel: normalized statistical weights to convert the total column densities to opacities.
Current usage metrics show cumulative count of Article Views (full-text article views including HTML views, PDF and ePub downloads, according to the available data) and Abstracts Views on Vision4Press platform.
Data correspond to usage on the plateform after 2015. The current usage metrics is available 48-96 hours after online publication and is updated daily on week days.
Initial download of the metrics may take a while.