Fig. B.1
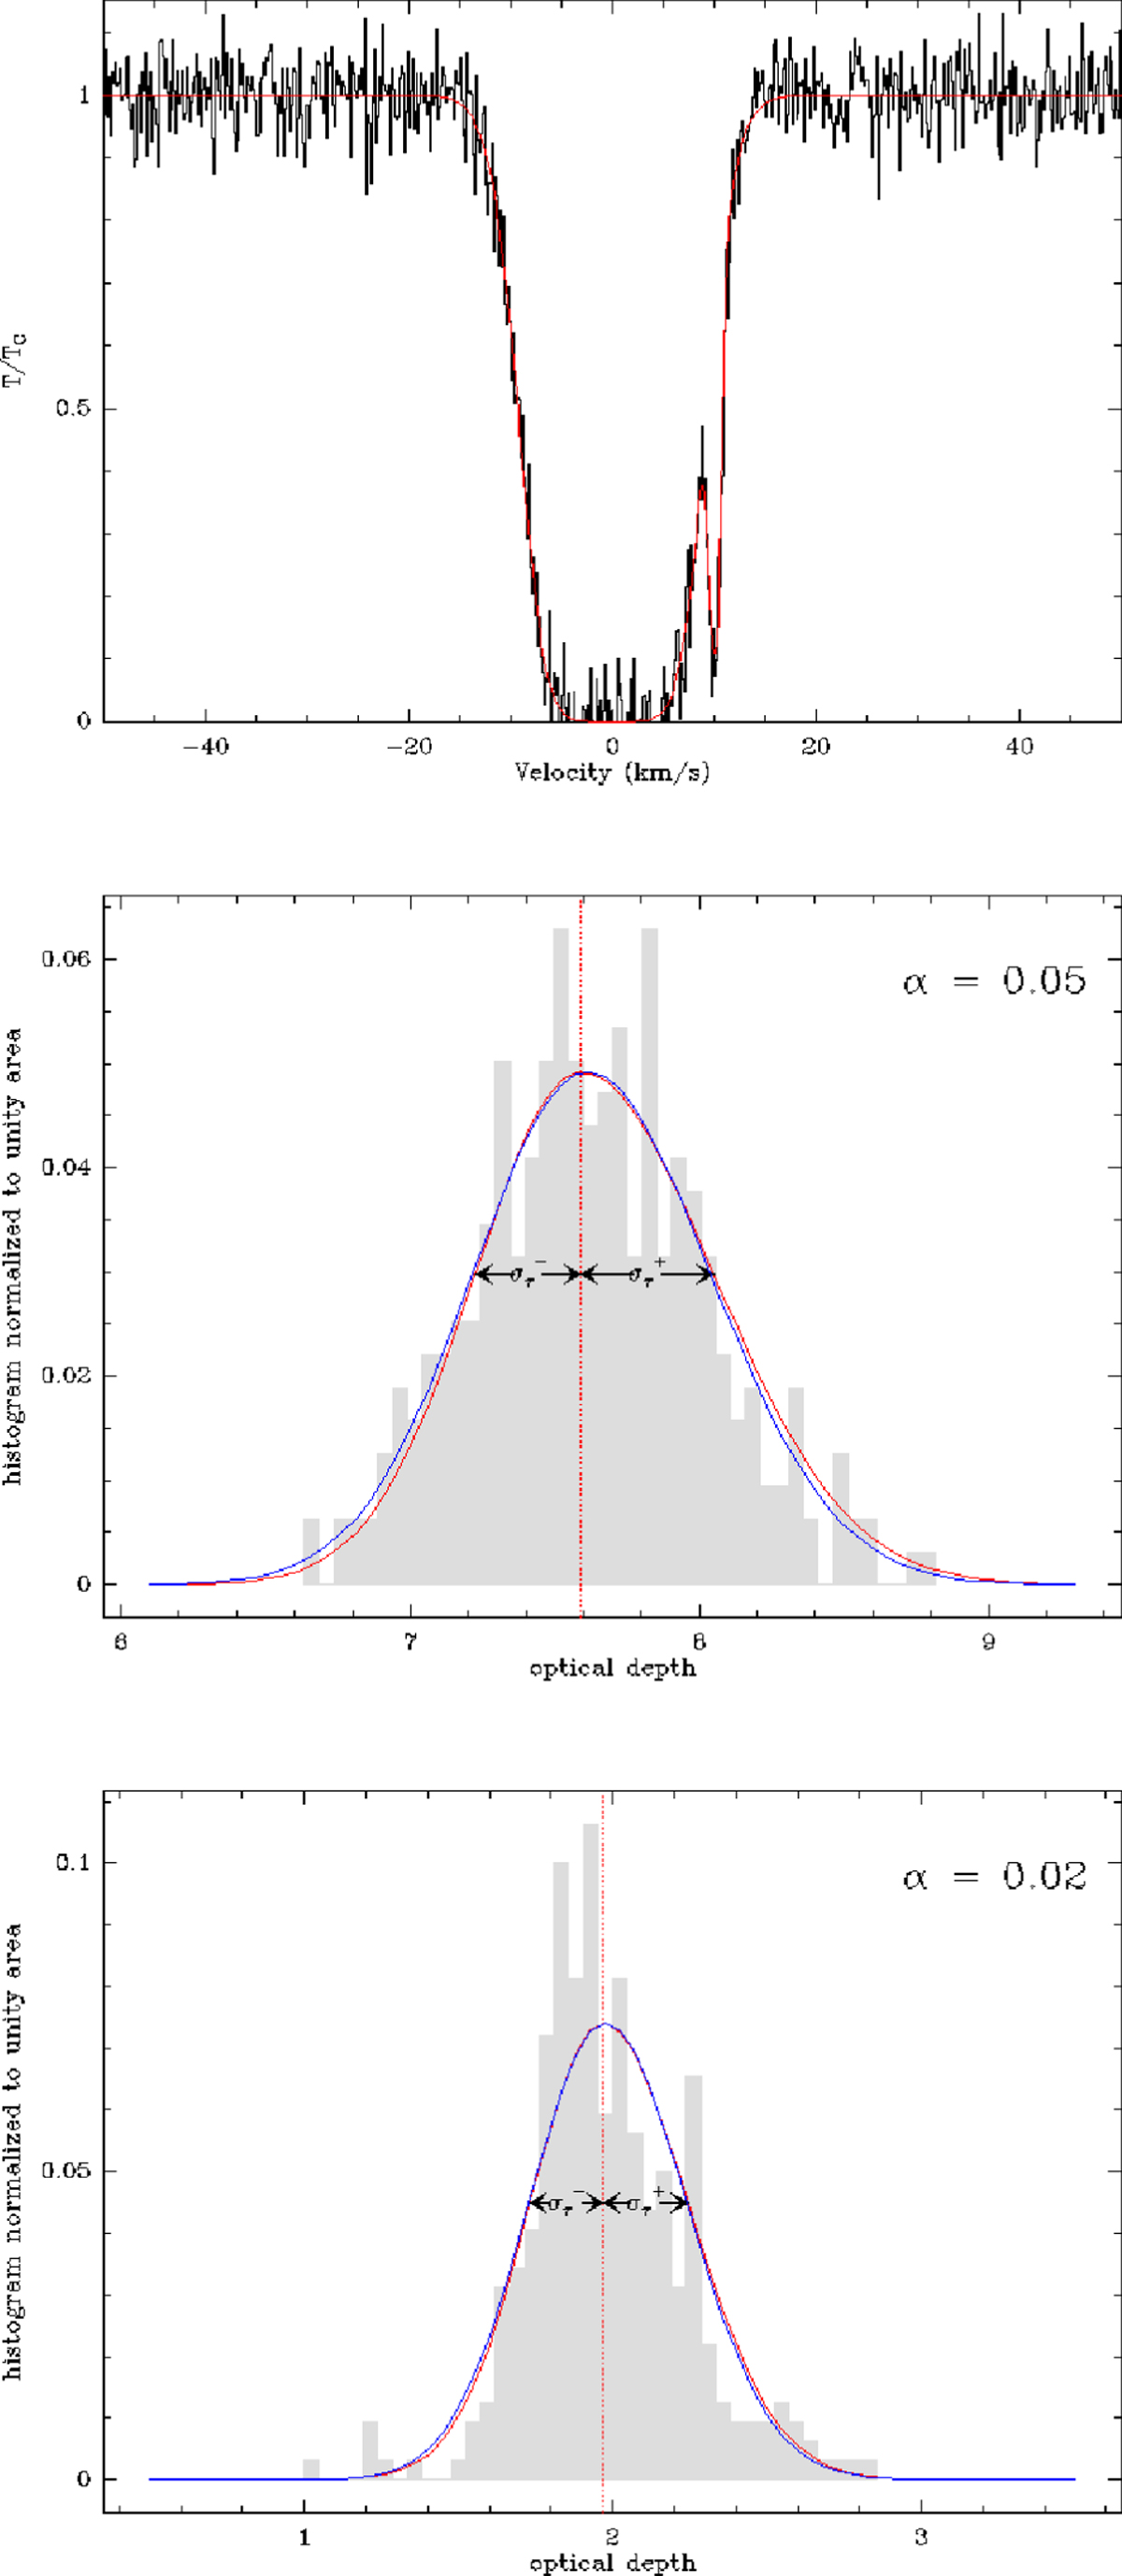
Demonstration of Bayesian error estimation according to Barlow (2003). Top panel: test profile. The signal-to-noise ratio of the continuum is 20. Center and bottom panels: histograms of the optical depth distribution, for the saturated absorption (center panel) and the narrower, unsaturated component (bottom panel). The dimidated Gaussians from models (1) and (2) are shown in red and blue, respectively, along with the asymmetric errors (arrows) and the asymmetry parameters α.
Current usage metrics show cumulative count of Article Views (full-text article views including HTML views, PDF and ePub downloads, according to the available data) and Abstracts Views on Vision4Press platform.
Data correspond to usage on the plateform after 2015. The current usage metrics is available 48-96 hours after online publication and is updated daily on week days.
Initial download of the metrics may take a while.